
What the Hunt for Interstellar Objects Teaches Small Businesses About Outliers
The search for rare interstellar visitors is really a lesson in pattern and anomaly detection. Here is how a small business can use the same idea with AI to catch the signal that matters.

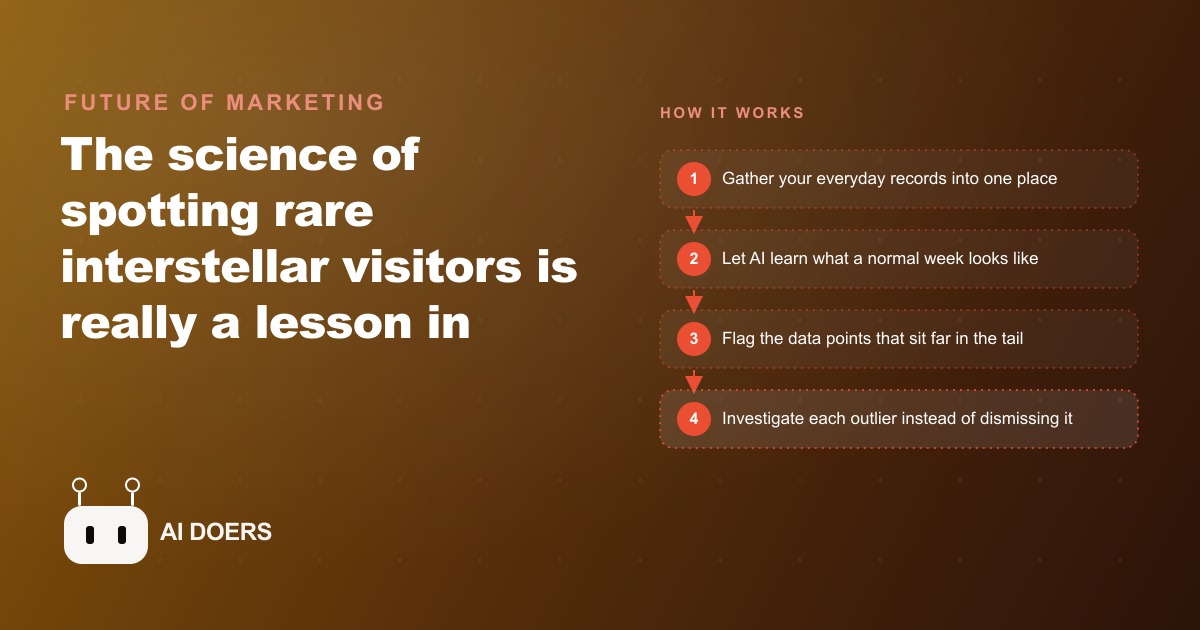
In 2023 a Harvard astronomer named Avi Loeb announced that his team had recovered fragments from what he believed was the third interstellar object ever recorded passing through our solar system. The first two, Oumuamua in 2017 and Borisov in 2019, had already upended assumptions about how frequently objects from other star systems visit our neighborhood. Loeb's argument was not primarily about the objects themselves. It was about what their rarity revealed about us. We have found only three of these visitors, he said, not because they are rare in the universe, but because we were not really looking, and the instruments we used were never built to notice them.
That sentence is the one I keep returning to. I am Madhuranjan Kumar, and I think it describes one of the most expensive habits in small business with a precision that no business book has managed. The foundation of good science, Loeb said, is the humility to learn, not the arrogance of expertise. What he meant is that expertise can blind you to the categories of things you have never seen before, because the mental models you have trained for years are very good at recognizing what they already know and very poor at holding open the possibility of something outside that range. An astronomer who has studied comets for thirty years will look at an unusual object and reach for comet explanations first, even when the object is moving at a speed no comet should achieve and decelerating in a way that no known mechanism explains. A geologist at a conference will look at an unusual economic question and try to apply the only tools they have. We all do this, and in most situations it costs nothing. In business, it costs a great deal, because the most important signal in your data is almost always the one that does not fit the pattern you have already learned to recognize.
The reason this matters right now is that every small business is generating more data than it has ever generated before. Bookings, service tickets, customer reviews, payment records, delivery logs, repeat visits, return rates, complaint categories, referral sources. All of it accumulates daily into a record that would have required an enterprise analytics team to process fifteen years ago and now requires nothing more than a spreadsheet and a question. The data is not the problem. The problem is what we look at in it. Almost every small business owner I have talked to reads one number: the monthly total. Sometimes the weekly total. Occasionally a year-over-year comparison. These are averages, summaries, the rocks that are everywhere. What they obscure is the interstellar object sitting in the tail of the distribution, the single data point that does not fit the pattern, the one that is either the earliest warning of a problem or the clearest signal of an opportunity that your competition has not yet noticed.
What training on normal actually reveals
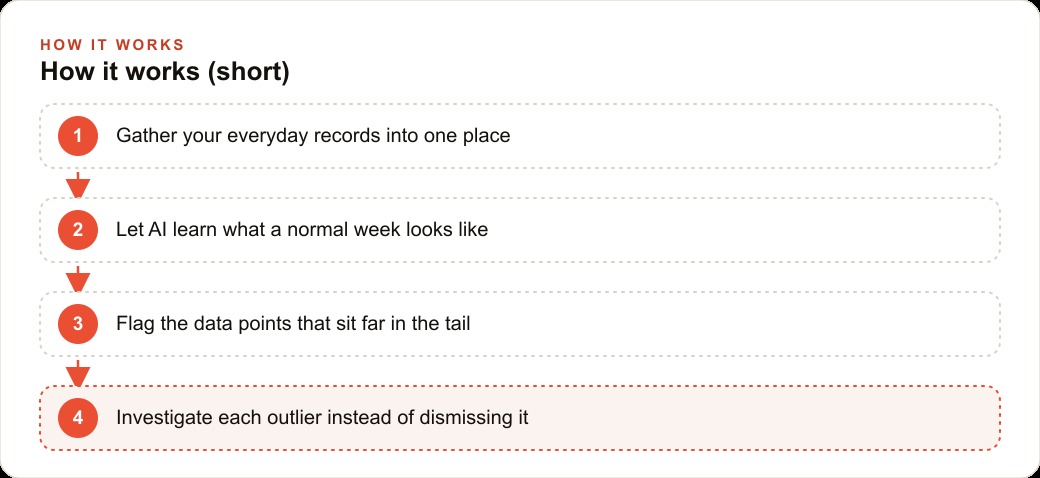
The scientific method for finding unusual objects in the sky is not to scan for unusual objects directly. It is to train a system on everything normal until anything abnormal stands out automatically. Loeb's team feeds the detection model millions of examples of birds, planes, satellites, helicopters, hot air balloons, and weather phenomena captured at every angle, every time of day, every light condition. Once the model has internalized every context in which a normal object appears, it can measure the distance from normal for any new observation. The objects that sit far enough from every known category get flagged for a second look. The flag is not a verdict. It is an invitation to investigate.
The math underneath this is classical statistics: standard deviations from the mean. The further out a data point sits from the center of the distribution, the more it deserves a human set of eyes. The practical insight is that you cannot find the unusual by looking for it directly. You find it by knowing normal so precisely that the unusual becomes unmissable. This is counterintuitive for a business owner because the instinct is to go looking for problems when things seem off. The more powerful habit is to let a system watch the data continuously and surface the points that break the pattern, so you are not relying on intuition or on accidentally noticing a spike during a Sunday afternoon review of the previous month's invoices.
There is a trap built into this that Loeb named with unusual clarity. Experts who have trained for decades in one domain tend to interpret every new observation through the lens of what they already know. A rock specialist sees rocks. The fix is not to become a non-specialist. The fix is to expand the training data so the system can hold open the category of things it has never seen before, and to stay curious enough to actually investigate when the flag goes up rather than reassigning the anomaly to the nearest known category and moving on with the rest of the morning. The humility to learn means treating each outlier as a question rather than as an inconvenient deviation from the pattern you were expecting.
For a small business, the translation is direct. You do not need a PhD and you do not need a telescope. You need a year of your own records and the discipline to ask one standing question every week: what in my data does not look like the rest. A modern AI tool can answer that question in seconds, scanning across every row, every date, every product, every ZIP code, every team member, looking for the one point that sits far from the center of everything else. The astronomer spent years and significant funding building a system to find one unusual visitor among billions of ordinary rocks. You can ask the same structural question about your own business data this afternoon with tools that cost nothing.
The business parallel, which is less abstract than it sounds
For a pest control company working a metropolitan area, the equivalent of the interstellar object is a ZIP code where rodent calls are coming in at three times the normal rate this week compared to the same week last year. Not somewhat higher. Three times higher. That is a data point sitting far in the tail, and it almost never appears in a monthly summary because it is swamped by the aggregate volume across all the other ZIP codes that are behaving normally. But it is exactly the kind of signal that, investigated promptly, reveals the front edge of an infestation spreading block by block through a neighborhood. A company that catches this signal early can proactively reach out to adjacent addresses, offer an inspection, and convert those homeowners before the problem becomes visible enough that they search for help themselves. A company that only reads the monthly total learns about the infestation two months later when the callback volume in that area starts climbing, at which point every competitor is also bidding for the same alarmed homeowners.
The same engine finds the opposite outlier too: a technician whose callback rate runs well above the team average across any measurement window. This rarely shows up in the shop's overall customer satisfaction score because it is absorbed by the majority of technicians who perform well. But it shows up immediately as an outlier if you ask the right question of your service records. The cost of catching this early is a conversation and some additional oversight. The cost of missing it is a customer base in a particular route that gradually erodes, followed by a reputation problem in that neighborhood that takes months to repair.
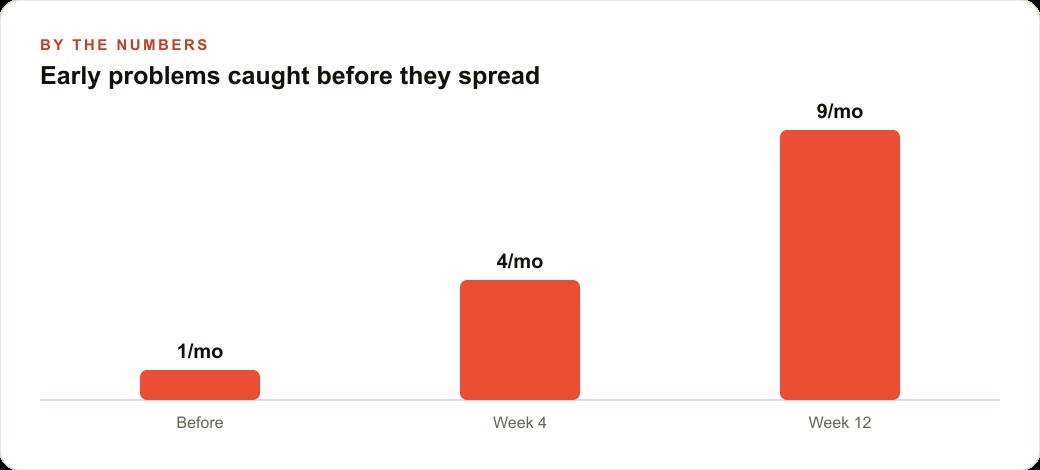
A restaurant using this approach finds the single menu item generating complaint mentions at three times the rate of anything else in the same price tier, which almost always signals a recipe inconsistency or a supplier change that nobody in the kitchen noticed because the overall satisfaction score is still sitting at four stars. An auto repair shop finds the appointment time slot with disproportionate no-shows, which often means a particular recurring customer segment has scheduling constraints that the current booking options do not accommodate. A yoga studio finds the Thursday morning class that has been losing attendance for six consecutive weeks before the drop becomes dramatic enough to notice without looking specifically for it.
In every case, the monthly total looked normal. The outlier was real and hiding inside it.
What it takes to build this is less than most people assume. A year of your own service records in one clean table, one row per job, with the date, the location, the service type, and the outcome. That is data most businesses already have scattered across invoices and booking systems. Pulling it into one sheet takes an afternoon the first time. Once it exists, you give it to an AI tool and ask one standing question on a schedule: show me which combinations of location, service type, and time period are sitting significantly above their normal baseline right now, and rank them by how far from normal they are. The model does the pattern recognition. You do the investigation. The cost of checking a flagged anomaly is small in almost every case: a phone call, an extra visit, a look at the supplier records. The cost of ignoring one that turns out to be real is measured in lost routes, lost regulars, or a neighborhood that chose a competitor because you were not watching.
This is Loeb's point about humility expressed in operational terms. When a flag goes up, the intellectually honest response is not to explain it away with the nearest comfortable interpretation. The honest response is to investigate and let the evidence decide. The interstellar object only becomes findable when you build a system good enough at recognizing normal that anything abnormal stands out immediately. The business data equivalent only becomes useful when you stop reading just the averages and start asking, every single week, what in this data does not look like the rest. That question, asked consistently and followed up with genuine curiosity rather than explanation, is worth more than any business intelligence dashboard I have seen sold to small business owners. The technology to answer it costs almost nothing. The discipline to keep asking it is the actual scarce resource, and the businesses that build that discipline first will see things their competitors miss by months.
The tools from 2024 that make this practical are already here. You do not need to wait for the next model release. You need your own records in one clean table and the habit of the weekly question. The astronomer built an instrument capable of noticing the unusual. Your instrument is the data you are already generating every day. The only question is whether you are pointing it at the right place.
The competitive angle is worth stating plainly. Two businesses operating in the same market with the same monthly revenue are not in equivalent positions if one is systematically surfacing early signals and acting on them while the other reads only the monthly total. Over twelve months that difference compounds into a real gap in customer retention, resource allocation, and problem-response time that is very difficult to close from behind. The business reading outliers catches problems when they are small and catches opportunities when they are new. The business reading averages catches both when they are large, which is also when they are most expensive to address and most visible to competitors.
There is no exotic capability required to start. Pull your last twelve months of service records into one spreadsheet this week. Identify the four or five variables that matter most: location, service type, technician, time of week, outcome. Give that sheet to an AI tool and ask it one question: which combinations in this data are sitting significantly outside their normal range compared to the same period last year. Run that question once. See what comes back. The first run will not be perfect. The data will have gaps and inconsistencies that need cleaning. But it will tell you something, and the act of taking the first outlier seriously, investigating it rather than explaining it away, is where the habit starts. Humility to learn is not a personality trait. It is a practice, and like any practice it compounds with repetition.
That is exactly what we do at AI DOERS. Book a private 30-minute call with Madhuranjan Kumar and we will map the fastest path to it for your specific business.
Book your call →
Madhuranjan Kumar
Madhuranjan Kumar brings 20 years of performance-marketing experience and has managed over $200 million in Facebook ad spend for brands across the United States and beyond. His expertise spans the full modern marketing stack: Meta, Google Ads, TikTok, email automation, CRM, and the websites that hold it together. At AI DOERS he turns that track record into lead-generation systems for businesses across every industry.