
The DIG Framework: How to Do Real Data Analysis With AI
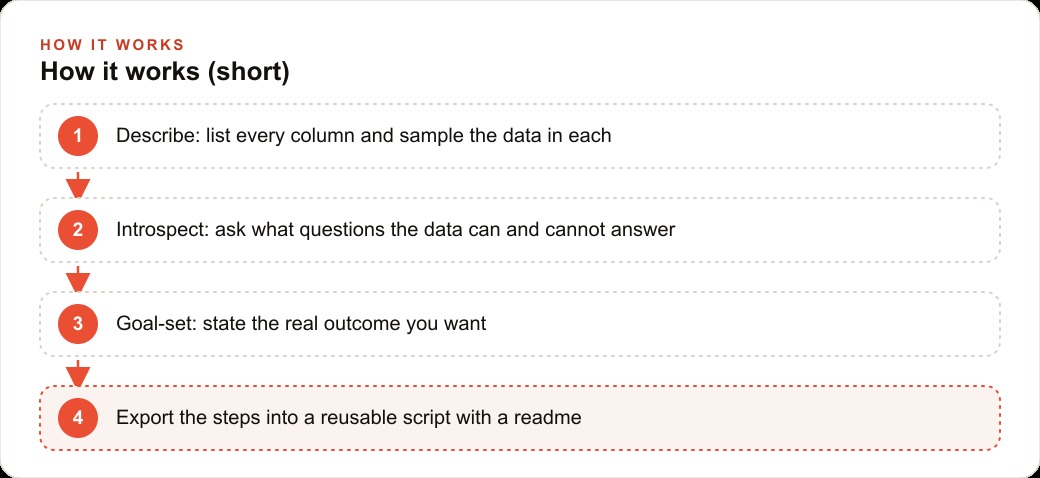
Do not start with charts. Run DIG first: ask the AI to Describe every column and sample it, Introspect for patterns and red flags, then Goal-set a clear outcome. This catches parsing errors and hallucinations before they spread through the rest of your analysis.

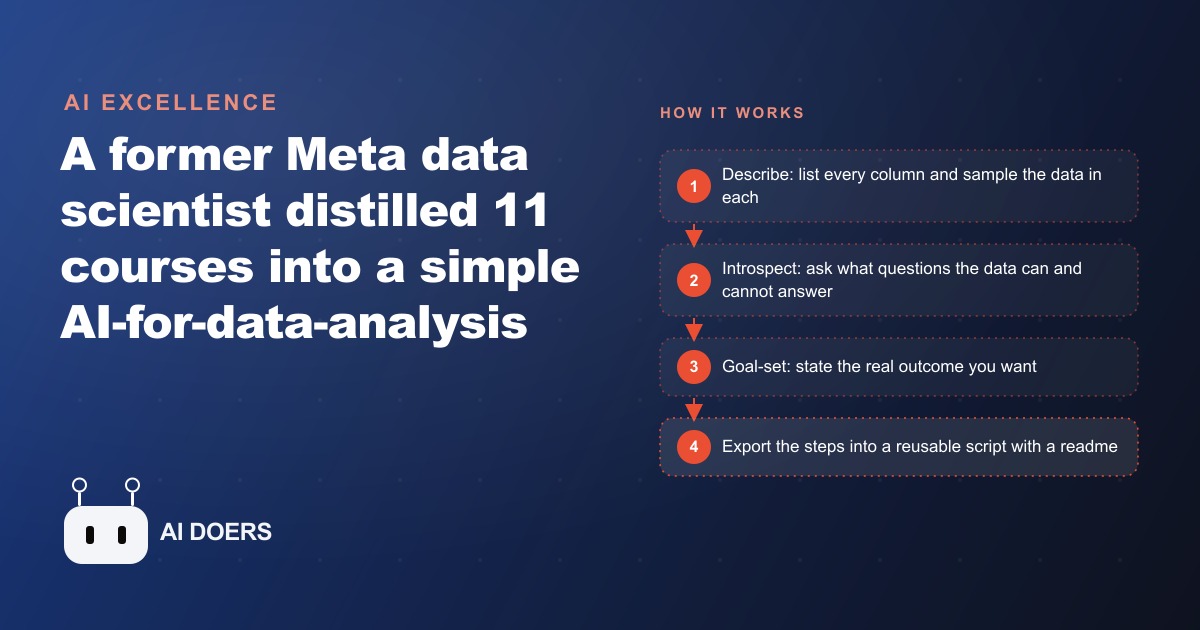
A former Meta data scientist distilled eleven courses on AI and data analysis into a three-step framework that takes five minutes at the start of any session and prevents the single most expensive mistake people make when they use AI on their spreadsheets. The framework is called DIG: Describe, Introspect, Goal-set. The reason it is news is not that data analysis with AI is new. It is that most people skip the first three steps and go straight to the charts, and that is where the expensive errors start.
I am Madhuranjan Kumar. The core insight here is simple but easy to miss: an AI model is only as good as the process you wrap around it. Upload a spreadsheet and ask for charts and you will get charts. Whether those charts are accurate depends entirely on whether the model read the data correctly. In data work, a single parsing error in step one propagates through every chart, summary, and decision that follows. DIG is the structural discipline that catches that error before it spreads.
The DIG framework is a correction to how most people start an analysis
Most people open an AI tool, upload a file, and ask for insights. That skips three steps that experienced data scientists never skip, because they know what happens when you do. DIG formalizes those steps for anyone who wants to do serious work with AI on data.
The framework works because it forces the model to understand the data before it analyzes it. That sounds obvious until you realize how often a model will silently read a column incorrectly and produce confident-looking wrong output. A date field formatted in a non-standard way. A revenue column where blank cells represent zero but the model treats them as missing. A category column where the same value appears under three different spellings. None of these produce an error message. They just produce wrong charts that look right until someone checks the source.
Before you even reach for AI, a useful frame is to ask whether the task benefits from AI at all. Use AI when it aids coordination, cuts tedious tasks, gives you a safety net, inspires better problem solving, or helps scale something that is already working. If the task does not fit one of those uses, a simpler tool might be faster and more reliable. DIG applies once you have confirmed the task belongs in AI.
Skipping the Describe step is where expensive errors begin
The Describe step is the one people skip because it feels slow. You ask the model to list every column in the dataset and show a sample of the data in each one. That is the whole step. It takes three minutes on a medium-sized file.
What it catches: missing values you did not know were there, parsing problems that would corrupt every chart downstream, columns that contain different things than their names suggest, and values that the model is reading wrong because of formatting. A column full of not-available labels is the first thing to investigate. Either the data is genuinely missing, which changes what you can claim in the analysis, or it is being parsed incorrectly, which means the model is working on garbage before you have asked it anything.
A few extra random samples per column confirm that you and the model are reading the data the same way. If the model says a column contains monthly revenue in dollars but the samples show values like Q1-2024 and Q2-2024, the model has the wrong reading and every calculation it makes from that column will be wrong. Catching this in the Describe step costs three minutes. Catching it after a report has been shared with a client costs credibility and hours of correction work.
The Describe step is also the practical defense against AI hallucinations on data. Hallucinations on factual questions often get the attention, but hallucinations on data analysis are less discussed and more expensive. They happen when a model fills in a gap it did not know existed. Running Describe first means you know where the gaps are and can correct the model's understanding before it builds anything on a wrong foundation.
Introspect turns a familiar dataset into a source of new questions
The Introspect step is where DIG goes beyond error prevention and into something more interesting. You ask the model for the interesting questions the dataset could answer and why it thinks they are interesting. You also ask what questions the data cannot answer, and why.
The first part of that question surfaces relationships you might have missed. A familiar dataset can hide insights that only become visible when you ask the model to look for what is there rather than confirming what you already believe. An expense file you have been analyzing monthly for a year might contain a pattern the model notices that you have been looking past because you are focused on the summary totals.
The second part, asking what the data cannot answer, is the more valuable question for avoiding a specific kind of expensive mistake. Many bad business decisions get made because an analysis confidently answers the wrong question with data that does not actually support the claim. An owner looks at a chart of website visitors by month, sees growth, and concludes that a specific marketing change drove the growth, when the data contains no information about what drove the traffic. The Introspect step surfaces that mismatch before anyone bases a decision on it.
Done well, the Introspect step changes what you analyze, not just how you display it. It regularly reveals that the variable you planned to analyze is too sparse to draw conclusions from, or that a column you were ignoring contains the most informative signal in the file. That kind of redirection early in the session saves the hours that would otherwise go into building an analysis around the wrong variable.
Goal-setting is the difference between a useful output and a generic one
The Goal-set step is the simplest of the three and the one that most changes the shape of the final output. You state the real outcome you want before you ask for any analysis. A prompt that says analyze this dataset produces generic output that covers the file without connecting to any real decision. A prompt that says the outcome is a quarterly board summary with three findings and one recommendation about where to reduce spend produces something you can use without heavy editing.
The goal shapes which aspects of the data the model emphasizes, how it structures the output, and what level of detail it goes into. An analysis aimed at a board summary needs different depth and language than an analysis aimed at a technical audit. The data is the same. The model is the same. The goal is what changes the output from generically correct to specifically useful.
For businesses that run regular reporting cycles, adding the Goal-set step to the start of every session also makes it easier to compare analyses across periods, because the structure stays consistent. Month-over-month comparisons are harder when every analysis has a slightly different shape. Stating the goal explicitly produces consistent structure as a side effect.
A traceability readme and a reusable script are the durable assets
The last move in the DIG workflow, and the one that turns a clever one-off into a compounding asset, is exporting the process. After the analysis is complete, you ask the model for two things: a traceability document covering what data was used, how it was analyzed, and threats to validity, and a reusable script with command-line arguments that runs the same analysis from start to finish.
The traceability document matters because it answers the question that always gets asked at the worst possible moment: how did you get this number? A brief readme that says the data came from this export on this date, was analyzed with this sequence of steps, and produced this output on this date is the thing that turns a confident claim into a defensible one. For any business that presents analysis to clients or leadership, this document is not optional overhead. It is the proof that the work holds up.
For a professional services firm that manages Google Ads reporting for clients, a traceability readme on every monthly performance summary means any team member can reconstruct the analysis, explain the numbers, and defend them if a client questions a figure. The script that produces the same analysis next month runs in minutes instead of hours, produces the same structure for easy comparison, and can be handed to anyone on the team with confidence that they are running the same analysis every time.
The reusable script also compounds over time in a different way. Once the analysis for a specific business need is scripted, the next version of the analysis benefits from every improvement to the underlying AI model without requiring any changes to the script. The structure stays the same. The quality of the reasoning improves automatically as the model improves. That is a compounding return on the investment of scripting it once.
For any business that also manages SEO content performance or tracks organic traffic, the same DIG discipline applied to a search console export or a content performance file produces the same quality improvement: fewer bad charts, clearer questions, and analysis that connects to real decisions rather than just describing the data. The discipline is transferable across every spreadsheet the business produces. The only investment is the five minutes of DIG at the start of each session, and the ten minutes to export a readme and a script at the end.
That is exactly what we do at AI DOERS. Book a private 30-minute call with Madhuranjan Kumar and we will map the fastest path to it for your specific business.
Book your call →
Madhuranjan Kumar
Madhuranjan Kumar brings 20 years of performance-marketing experience and has managed over $200 million in Facebook ad spend for brands across the United States and beyond. His expertise spans the full modern marketing stack: Meta, Google Ads, TikTok, email automation, CRM, and the websites that hold it together. At AI DOERS he turns that track record into lead-generation systems for businesses across every industry.