
How to Scale Your AI Automation Pipeline
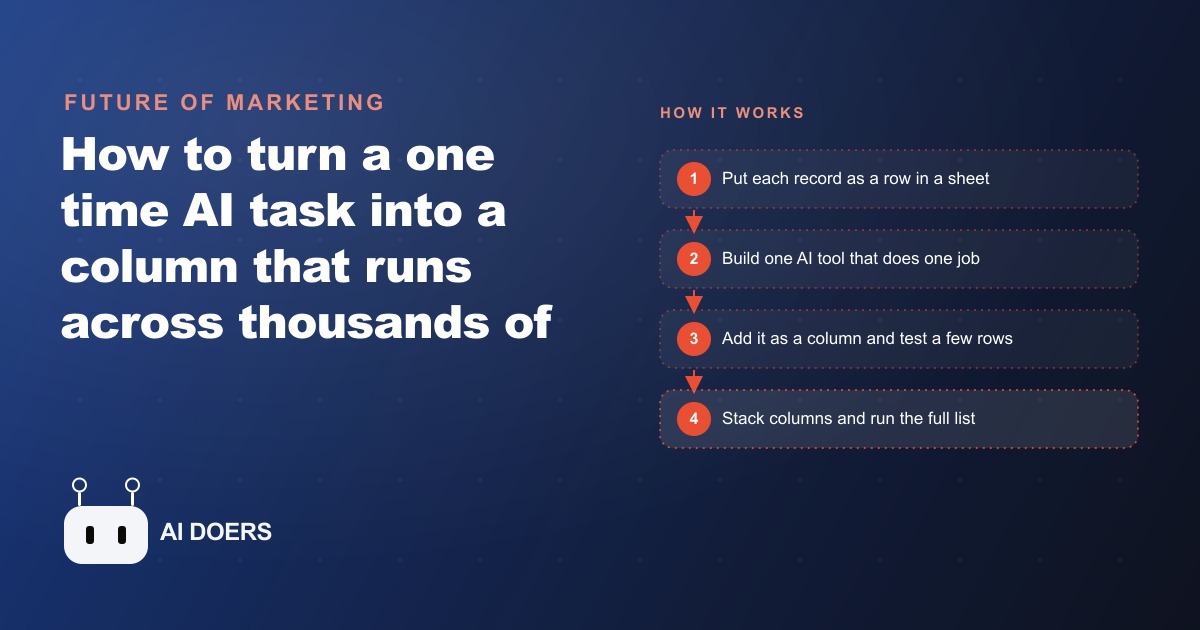
Turn a one time AI task into a spreadsheet column that runs across thousands of rows. Here is how it works and how an e-commerce store would use it.

Within two years of large language models becoming widely available for business use, the spreadsheet became the dominant interface for running them at scale, and that pattern is not a coincidence.
I am Madhuranjan Kumar, and I want to unpack why the row-and-column model maps so naturally onto AI automation, what it unlocks for any business that handles lists of similar records, and where the model breaks down in ways most enthusiasts are not talking about yet. The intuition behind spreadsheet-native AI pipelines is simple: every row is one task, and every AI step is one column. Set that up correctly and a job that cost thirty minutes per record now runs across ten thousand records overnight. But the deeper analysis reveals both the genuine power of the model and the specific places where it fails, and those failure modes are as important as the upside.
The spreadsheet as the universal AI interface, and why that is not an accident
The spreadsheet is not an obvious choice for AI workflows. It is decades-old software built around manual data entry and arithmetic formulas. But it has two properties that make it exceptionally well suited to AI pipelines. First, it enforces a consistent structure. Every row follows the same schema. Every column applies the same operation to every row. That regularity is exactly what language models need, because a model asked to perform the same task on row after row in a consistent shape produces far better results than one asked to handle a chaotic, unstructured input where every item is slightly different. Second, the spreadsheet is already where business data lives. Sales leads, product catalogs, customer records, inventory lists. These collections exist in spreadsheets not because spreadsheets are ideal databases, but because spreadsheets are the tool that non-technical people reached for when they needed to organize lists, and that habit is universal across industries and company sizes.
The emergence of no-code tools that plug AI directly into spreadsheet columns explains most of the enthusiasm around AI automation in the past two years. The interface did not need to change. What changed is that a column can now run a language model instead of a SUM formula. That is a significant shift in what a spreadsheet can do, and most businesses are still discovering the practical implications.
The universality is real. The row-and-column model works for almost any task that involves processing a list of similar items. Product descriptions. Lead research. Document classification. Invoice field extraction. Email personalization. Translation. Sentiment analysis. In every case the structure is the same: the item is the row, the AI task is the column, and the result is the populated cell. The underlying model the column calls might be different, the tool chain might be different, but the interface is always the spreadsheet. That consistency is why the format has become a default entry point for AI automation regardless of the platform being used.
How stacking columns creates compound intelligence instead of repeated effort
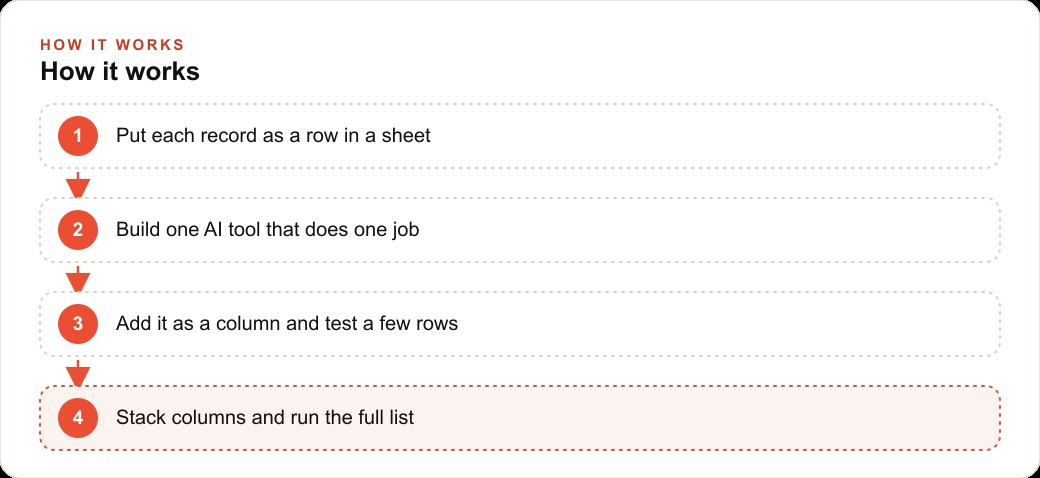
A single AI column is useful but limited. It does one job and returns one result. The real power of the row model emerges when you stack columns so that each one feeds the next. The output of column one becomes the input to column two. The output of column two feeds column three. Each layer can call a different model, use a different tool, or apply a different prompt, but they all operate on the same row. That is compound intelligence: each column makes the row richer than it was before, and the final column produces something that no individual step could have generated on its own.
A concrete example makes this clear. An e-commerce store with several thousand products needs clean titles, benefit-focused descriptions, suggested tags, and a category assignment. Doing that by hand is slow, and the quality drifts as the team gets tired. One AI column rewrites each product title to a consistent format. A second column reads that clean title and writes a description focused on customer benefits rather than raw specifications. A third column reads both the title and the description and suggests tags and a category. A fourth column reads all three outputs and drafts a short ad hook for campaigns running through paid social ad channels. Each column does one thing well. The pipeline as a whole produces four distinct, coherent outputs from one raw input row, with each output informed by the ones produced before it.
Without column stacking, producing those four outputs requires four separate manual processes. A person writes the title, then writes the description, then assigns tags, then drafts ad copy, each step done in isolation without reference to the others. The stacked pipeline is not just faster. It produces more internally consistent results because every column builds on a shared foundation rather than each person interpreting the raw input differently on a different day with different energy.
The same pattern works for customer pipelines. One column summarizes a customer's order history. A second column identifies their likely preferences based on that summary. A third column drafts a personalized win-back message using those preferences. A sales team managing hundreds of accounts can run that pipeline across the whole customer base in an afternoon and arrive at a stack of personalized outreach that a human team would have needed weeks to write individually.
Stack one more column and the pipeline extends to ad creative. A column that reads the personalized message and generates three headline variations for a Google Ads remarketing campaign turns a customer retention pipeline into a full-cycle advertising workflow, all driven from the same spreadsheet of order records.
The visibility advantage: every output is auditable, every error is locatable
One of the properties that makes the row model genuinely superior to other AI workflow designs is visibility. Because each AI step is a column, and each column's output is a cell in the same spreadsheet, you can see exactly what happened at every stage for every row. If the output of column three looks wrong for a specific product, you look at columns one and two for that same product and trace exactly where the result diverged from what you expected.
That traceability is not just a debugging convenience. It is a quality control mechanism that is built into the architecture rather than added as an afterthought. When a column produces bad output for some rows and good output for others, the visibility makes it easy to identify the pattern. Maybe the column handles short titles well but struggles with long ones. Maybe it works for products in one category and fails for another. Because you can see every input and every output in the same interface, you can spot the pattern, adjust the prompt for that column, and rerun just the affected rows rather than rebuilding the pipeline from scratch.
This is a meaningful advantage over black-box AI workflows where a request goes in and an answer comes back with no visibility into the intermediate steps. When those workflows produce a bad result, diagnosing the cause means reconstructing the entire process from scratch with no intermediate data to examine. The spreadsheet model gives you the full audit trail at no additional cost, as a natural result of how columns work.
For businesses that need to review AI output before it reaches customers, the column structure also makes review more efficient. A human reviewer can scan a column of AI-generated product titles and spot the outliers quickly because all titles are in the same place in the same format. Reviewing a flat column of similar items is faster than reviewing a diverse set of documents where each has its own formatting, length, and context.
For businesses that connect outputs to advertising systems, a visible pipeline also makes it easier to understand which step is producing the material that drives results. When a specific campaign performs well on certain product categories, you can trace back through the columns to identify which title format, which description style, and which tag set was used for those products. That connection between pipeline output and business outcome turns a content factory into a feedback loop rather than a one-way production line.
Where the row model breaks down: the edge cases nobody talks about
The row model has real limits, and those limits are worth understanding before committing significant work to a pipeline built on them. The first limit is what I call the flat-row assumption. The model works well when every row is genuinely similar. When the rows in your list are highly variable, when some records need deep multi-source research and others are trivial lookups, the one-size-fits-all column breaks down. A single prompt cannot serve a row that requires three sources and thirty seconds of reasoning and a row that needs none. You end up either over-engineering the column for the simple rows, making the whole pipeline slow and expensive, or under-serving the complex ones, making the output shallow and incomplete.
The second limit is token economics at scale. Running a deep AI pipeline across tens of thousands of rows costs real money. Each cell in each AI column consumes tokens. A pipeline with five columns across fifty thousand rows is a substantial token spend. That cost is often worth it, but it needs to be planned before the first run rather than discovered on the first invoice. Many businesses design a pipeline without calculating the per-row cost, run it across their full dataset, and find the bill surprising.
The third limit is dependency sequencing. If column three depends on the output of column two, you cannot run column three until column two is finished for a given row. In a straightforward synchronous pipeline this is fine. But if the pipeline processes rows in parallel batches to save time, you need to manage dependencies carefully or column three starts running before column two has produced its output for some rows, which generates errors that are genuinely hard to trace back to the sequencing problem.
The fourth limit is drift under model updates. A prompt that produces excellent results today may produce subtly different results after the underlying model is updated by the provider. If you built a pipeline six months ago and run it again on the same data today, the column outputs may differ in ways that are not obvious without a baseline comparison. Any pipeline that runs repeatedly over time needs a sample of known-good outputs that it can compare against after any model update, so drift is caught before it affects the full dataset.
None of these limits make the row model unworkable. They make careful design a requirement rather than an option.
From a static list to a live pipeline that updates itself
The most powerful version of the row model is one that does not sit still. A static list runs the pipeline once and is done. A live pipeline monitors a source for new rows, runs them through the same columns automatically, and updates results as the underlying data changes. That is where the row model becomes genuinely transformative for a business, because the pipeline is no longer a batch job someone remembers to schedule. It is an always-on operation that keeps the data current without manual intervention.
Setting this up requires connecting the spreadsheet to a trigger. New rows can arrive from a form submission, a CRM update, a scheduled data pull, a webhook from another system, or a direct database connection. When a new row appears, the pipeline runs on that row and fills in the AI columns. The output lands in the sheet without anyone touching it.
For a sales team managing inbound leads, this means every new lead is researched, scored, and enriched the moment it enters the system. The team starts each day with prepared, qualified leads rather than raw form submissions that require manual research to make useful. For a content team tracking competitors, it means every new piece from a monitored source is summarized and categorized the moment it is published, without anyone having to remember to check. For an operations team processing invoices, it means every new invoice is extracted and validated before the accounts team opens their inbox.
The connection to other business systems deepens the value further. An enriched lead from the pipeline can flow automatically into a CRM system where the sales process takes over from there. A pipeline that surfaces trending topics in a niche can feed directly into an SEO content planning calendar, giving the content team a research-backed topic list without a separate research step. A product enrichment pipeline that updates descriptions and tags can push directly to the e-commerce platform, keeping the catalog current without a manual review step for every update.
The row model becomes connective tissue between data sources and the business tools that act on that data. The goal is not to remove human judgment from the process. It is to ensure that human judgment is applied to rows that are already enriched with the most useful information the pipeline can provide, rather than to rows that are still raw and require manual research to make actionable. The human decides. The pipeline handles the preparation that makes the decision well-informed and fast.
That is exactly what we do at AI DOERS. Book a private 30-minute call with Madhuranjan Kumar and we will map the fastest path to it for your specific business.
Book your call →
Madhuranjan Kumar
Madhuranjan Kumar brings 20 years of performance-marketing experience and has managed over $200 million in Facebook ad spend for brands across the United States and beyond. His expertise spans the full modern marketing stack: Meta, Google Ads, TikTok, email automation, CRM, and the websites that hold it together. At AI DOERS he turns that track record into lead-generation systems for businesses across every industry.