
GPT-5.4 vs Claude Opus 4.6 vs Gemini 3.1: Which Model Wins What
No single model wins everything. GPT-5.4 leads deep research and writing, Claude Opus 4.6 owns coding and SVG, and Gemini 3.1 leads design but trails on heavier logic, so the right model depends on the task.

For six months, the agency sent every task to the same model out of habit, and for six months the rewrites piled up in a pattern nobody had noticed until they ran the same client brief through all three models in a single afternoon.
The problem that started everything: six months of invisible rewrite debt
The agency had twelve staff members who used AI tools daily for client work: research, writing, design briefs, landing page copy, ad creative reviews, and client-facing summaries. All of them had defaulted to the same model. It was the one installed when the team first adopted AI tools, the one everyone had learned to prompt, and the one that was demonstrably good at some of the work. For months, nobody questioned whether it was the best choice for every type of task, because it was reliable enough that questioning felt unnecessary.
The hidden cost accumulated slowly. The writing team rewrote AI-produced research briefs frequently, adding the depth the drafts lacked. The developers found that code generated for simple interactive components needed more correction than they expected. The account managers reworded summaries that came back technically accurate but tonally flat. None of these correction patterns were tracked explicitly. They were absorbed into the workday as ordinary polish, the kind of clean-up that is always part of the process.
It took a project coordinator to notice, while reviewing time logs for a quarterly analysis, that the team was spending an average of forty-five minutes per day per person on rewrites of AI-generated content. Across twelve people, that was ninety hours per week of rewrite labor. The model was producing first drafts, but the drafts were consistently good enough to use as a base and consistently not good enough to send as delivered. The question nobody had asked was whether a different model would reduce that rewrite time on the specific task categories where it was highest. The coordinator raised it in a team meeting and the decision was made to test all three leading models on the same real tasks in a structured afternoon rather than assume the status quo was optimal.
Madhuranjan Kumar observes this pattern across teams in a range of industries: the first model adopted becomes the default by inertia, and inertia is invisible until someone runs a controlled comparison and the difference in output quality is suddenly obvious rather than theoretical.
What the first afternoon of side-by-side testing revealed
The agency chose a real client brief as the test input rather than a synthetic prompt, because real work has the nuance and specificity that reveals real model differences. The brief described a client in the home renovation space who needed a competitive market analysis, a three-page capability summary for their sales team, a set of Facebook and Instagram ad concepts with three headline variants per concept, and a simple landing page component that displayed a service comparison table with a lead capture form below it.
All three models received the same brief in the same session, one after another, and their outputs were collected without editing. The team gathered in the afternoon to review the outputs together, rating each one in four categories: research depth, writing quality, design-concept clarity, and code correctness.
The results were faster to read than the team expected. They were not evenly distributed. Each model had a clear lane where it outperformed the others, and the performance differences were large enough to be immediately visible without needing a scoring rubric to distinguish them. The model that had been the team's default was not the strongest overall. It was the strongest in one category and weaker than either alternative in two others. That single afternoon made a months-long assumption visible, and the assumption did not survive contact with the data.
One detail stood out beyond the ratings: the winning model on deep research had spent considerably more time generating before returning its output, visibly checking multiple conceptual angles and cross-referencing different dimensions of the market before drafting. The faster models returned text sooner but had clearly skipped the verification pass. Speed in generation was not the same as value in output, and the team had been implicitly optimizing for speed by defaulting to the fastest model for everything.
What the results showed about each model's actual lane
On the competitive market analysis and the capability summary, one model returned a document that was deeper, better sourced, and more analytically coherent than either of the alternatives. The other two returned documents that were well-organized and readable but shallow on evidence and missing several important dimensions of the market the client operated in. The distinction was not subtle. The winning model on research asked clarifying questions before generating, checked multiple conceptual angles, and produced a draft requiring minimal substantive rewriting rather than the usual forty-five-minute polish pass.
On the ad creative concepts and the persuasive sections of the capability summary, the performance was more competitive but still clearly separated. The model that won on research also produced the strongest long-form persuasive writing, with more original framing and a more consistent voice across sections. The agency's default model produced writing that was technically sound but noticeably more generic in its phrasing. The third model fell between them on writing quality.
On the landing page component, specifically the service comparison table and lead capture form with validation logic, the results separated sharply. One model produced a clean, working component on the first pass: correct HTML structure, properly scoped CSS, and functional form validation. The other two produced components that worked partially and required debugging before they could be used. The model that won on coding also produced the strongest SVG output when the team tested it on an icon set the client had requested. The coding-and-graphics winner was a different model from the research-and-writing winner.
On the design brief and the overall layout concept for the landing page, the three models were closer in quality, but one returned a description that was immediately usable as a briefing document for the visual direction, with specific element proportions and color logic that the design team could act on directly. That model was also the fastest of the three to return usable output on design layout.
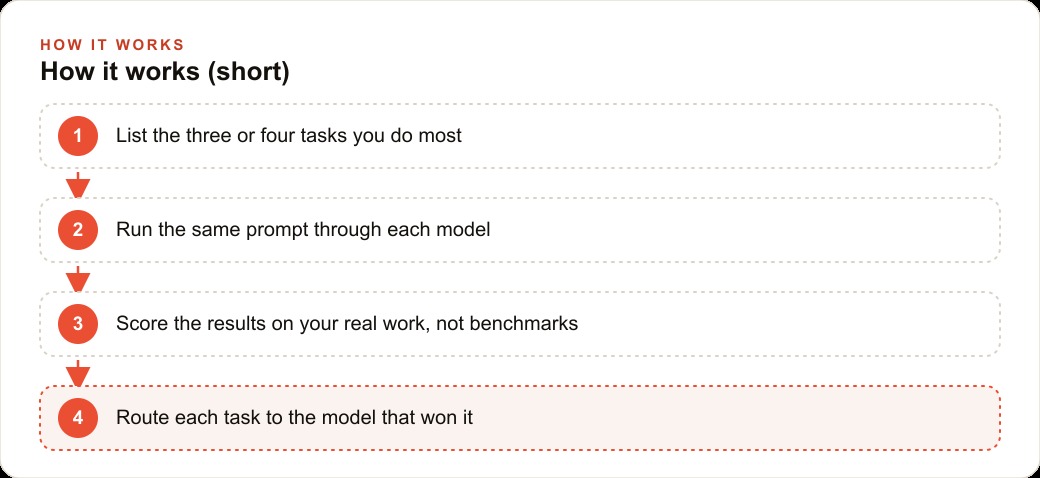
The routing decision that emerged from the afternoon was clear enough to write down in a table: deep research and intensive writing go to one model, coding and visual markup go to a second, and fast design layout goes to a third with some caution applied to anything requiring heavy logic.
Building the routing cheat sheet and teaching the team to use it
After the afternoon of testing, Madhuranjan Kumar would have recommended spending an evening writing a one-page routing guide from the results. The coordinator did exactly that. The guide listed the task categories the agency handled most frequently and, for each one, named which model the test had shown was strongest and what the practical rule was for choosing. It was not a complex document. It was a table with four rows and two columns: task category, and model to use.
The harder part was getting the team to use it consistently. Most staff had developed habits around the default model, including specific prompt styles and personal shortcuts that worked reliably on that one model. Switching tasks to a different model meant re-learning prompting patterns for that model's particular response style, which had a real short-term cost in confidence and speed. The coordinator ran two short training sessions in the first week: one covering the research-and-writing model and one covering the coding-and-graphics model. Team members ran their own real tasks and shared the results with each other. By the end of the second week, most of the team was routing research tasks to the research model and coding tasks to the coding model without consulting the guide.
The account managers took longer to shift, partly because their work spans several categories and the routing decision is less clear-cut when a single deliverable contains a mix of research synthesis and persuasive writing. The solution was a simple decision rule added to the guide: when the deliverable is primarily client-facing and needs persuasive voice, use the writing model; when it primarily summarizes factual research, use the research model. That rule covered most of the ambiguous cases without requiring the account managers to deliberate on the model choice for every task.
The guide was pinned at the top of the team's main project management workspace, visible without searching. That placement removed the friction of remembering to consult it, which turned out to matter more than anyone expected. A habit that requires conscious effort to trigger is a habit that breaks under deadline pressure. A guide that is always visible becomes a natural check that survives deadline pressure because glancing at it costs nothing.
Twelve weeks later: what the quality improvement looked like and what the routing habit cost to build
At week four, the team ran a structured quality review using saved outputs from the same client work categories as the original test. The rewrite time per person per day had dropped from forty-five minutes to approximately twenty-five minutes. The improvement was not uniform. The deepest gains were on research and long-form writing, where the correct model produced substantially more usable first drafts than the team's previous default. The coding improvement was similarly sharp. The smallest gain was on design briefs, where the performance difference was real but smaller than in the other categories.
By week twelve, daily rewrite time had stabilized at approximately fifteen minutes per person per day, a reduction of thirty minutes compared to the pre-routing baseline. Across twelve people, that was six hours per day, roughly thirty hours per week, of recovered capacity. The team directed that capacity primarily toward client-strategy work requiring human judgment, the kind of work clients value and notice rather than polished first drafts of standard deliverables.
The quality improvement also showed up in a metric the team had not set out to track: client-requested revisions per deliverable. Before the routing change, clients requested revisions on roughly one in four deliverables. At week twelve, that ratio had dropped to roughly one in seven. The deliverables were not just taking less time to produce internally. They were landing better with the people receiving them.
The habit cost was real and worth naming. Building the routing habit required two weeks of conscious effort and mild discomfort, because it is genuinely more mentally demanding to make a routing decision before starting a task than to open the familiar interface by reflex. By week six, most of the team described the routing decision as automatic rather than deliberate, similar to how choosing the right tool in a physical trade becomes automatic after enough practice. The two weeks of deliberate effort were a genuine investment, and the return began compounding from week three onward as the team got faster at prompting the new models effectively.
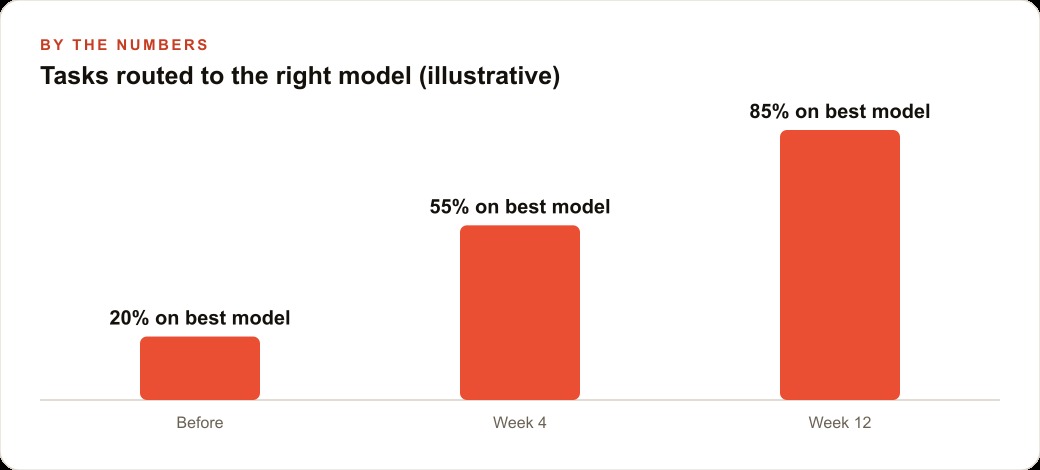
The full twelve-week improvement is what the graph above represents: a small fraction of tasks going to the optimal model in week one, rising through week four as habits formed, and reaching a stable majority by week twelve. The percentage never reached one hundred because some tasks genuinely do not have a clear winner between models, and the team learned to use the default model's native strengths for those borderline cases rather than forcing them into a routing category where they do not clearly belong. That nuance is the difference between a rigid system that breaks on edge cases and a practical habit that holds up across a full quarter of real client work.
The most important lesson from the twelve weeks is not which model won which category. Those rankings will shift as models continue to improve, and any team that treats the current routing table as permanent will find it drifting out of alignment with reality over the following months. The lesson is the practice of running structured comparisons on real work, writing down the results, and adjusting the routing guide when the results change. A team that re-tests every two to three months and updates the guide accordingly has a living system that stays useful. A team that runs the comparison once, stores the guide, and never revisits it has a snapshot that ages into noise.
That is exactly what we do at AI DOERS. Book a private 30-minute call with Madhuranjan Kumar and we will map the fastest path to it for your specific business.
Book your call →
Madhuranjan Kumar
Madhuranjan Kumar brings 20 years of performance-marketing experience and has managed over $200 million in Facebook ad spend for brands across the United States and beyond. His expertise spans the full modern marketing stack: Meta, Google Ads, TikTok, email automation, CRM, and the websites that hold it together. At AI DOERS he turns that track record into lead-generation systems for businesses across every industry.