
Gemini 3 Pro Builds the Revenue Dashboard Your Chiropractic Practice Has Been Running Without
Google's newest frontier model creates live interactive dashboards, patient-facing content, and financial projections from plain-language prompts, with math that checks out and a free entry point for any practice.

Small practices have always done their financial planning on Saturday mornings, when the week is quiet enough to sit with a spreadsheet and think about whether the revenue trend is pointing in the right direction. The owner of a six-provider chiropractic practice Madhuranjan spoke with last month described the routine clearly: pull the billing data, build a scenario by hand, and spend three hours producing a number she was not entirely confident in because the formula was always one wrong cell reference away from producing a wrong answer. This is the week that routine becomes optional.
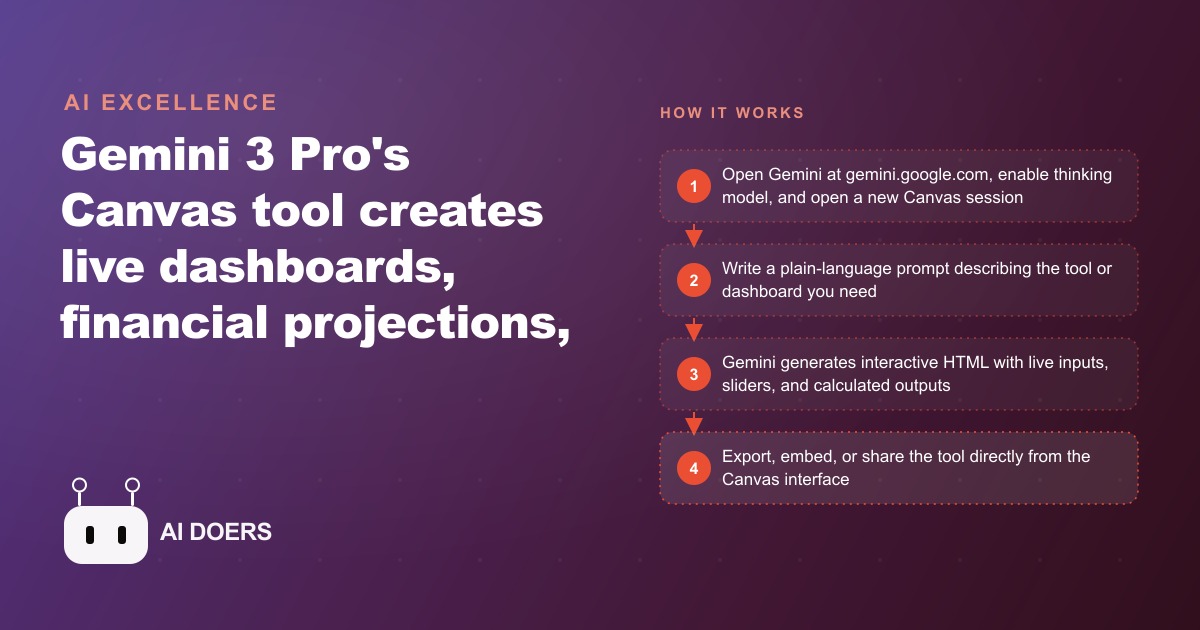
Gemini 3 Pro's Canvas tool builds live, interactive financial models from plain-language prompts. Not static spreadsheets. Not text descriptions of what a spreadsheet might look like. Working tools with sliders, adjustable inputs, and real-time calculated outputs that update as you move them. The first test Madhuranjan ran was a multi-unit real estate investment dashboard with vacancy sliders, interest rate inputs, break-even visualizations, and a PDF report generator. Every formula was verified manually after generation. Every formula was correct on the first attempt.
That is not a typical result from an AI tool applied to financial math. It is the result that changes what a practice owner should expect from a free afternoon and a plain-language prompt.
The tools that used to require a data science team now fit inside a single afternoon prompt
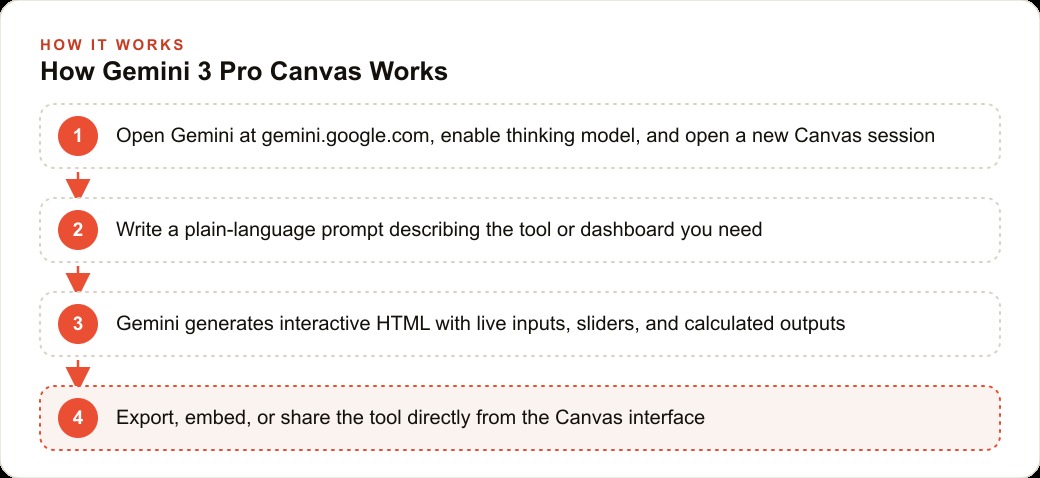
Canvas generates interactive HTML directly inside the Gemini interface. When you describe a financial tool you need, Canvas does not produce a document explaining how to build it. It builds the tool. The output opens in a browser, accepts inputs, and recalculates in real time. Move a slider for patient visit volume and watch the revenue projection and overhead coverage update instantly. Adjust the reimbursement rate assumption and see how the break-even point shifts. Run 10 scenarios in the time it used to take to type 10 formulas into a spreadsheet.
This is not incremental improvement on what AI tools could do before. Text-based AI responses describing financial projections are useful in the same way that a written description of a map is useful: they get you somewhere, but they are not the same as holding the map. Canvas produces the map. The interactive tool is the deliverable, not the instructions for building one.
The 24-month revenue projection test confirmed this. A prompt describing a practice's patient volume, reimbursement mix, fixed overhead, and growth assumptions produced a 24-month projection table with adjustable inputs in under two minutes. The math was verified across all 24 months. Correct on the first attempt. A built-in features button appeared on the output and suggested additions including scenario comparison and export formats that improved the utility of the tool without requiring the user to think of those additions independently.
The 1 million token context window that Gemini 3 Pro carries matters for practices that want to work with dense reference material. A full clinical protocol manual, a collection of payer reimbursement schedules, or a 90-day visit history for a patient cohort can all fit inside a single conversation. The model holds all of it simultaneously and can build tools that reference any part of the material without losing earlier context the way models with smaller windows do. For a practice doing insurance payer analysis across dozens of payers with different rate schedules, the ability to load all of that into one session and work across it is a practical advantage.
Thinking mode shows the reasoning process before delivering a final answer. When a financial calculation comes back, the visible reasoning trail shows which assumptions the model made and how it derived each number. If an assumption is wrong, you can see it in the reasoning output and correct it rather than receiving a confident wrong answer with no explanation. That traceability makes verification faster and more reliable than checking the output of a model that produces answers without showing its work.
What happens when a financial model verifies correct on the first try
The standard reaction when an AI tool produces a financial calculation is to verify it skeptically. AI models hallucinate. They produce confident-sounding numbers that are wrong in ways that are hard to catch without checking the underlying math. This reaction is reasonable and should not go away entirely. But the verification result in the tests documented here changes the practical question from "is this reliable enough to use as a starting point" to "is this reliable enough to use as the actual tool."
The multi-unit real estate dashboard tested had 14 distinct formulas driving the interactive outputs. All 14 were correct after manual verification. The chiropractic revenue model that followed had 9 core formulas across 24 months of projection. All 9 were correct. These are specific test runs, not a comprehensive reliability audit across every possible use case. A practice owner should still verify any tool before using it for real business decisions. But the first-attempt accuracy in these tests was high enough to shift the practical workflow from "generate and extensively correct" to "generate and spot-check."
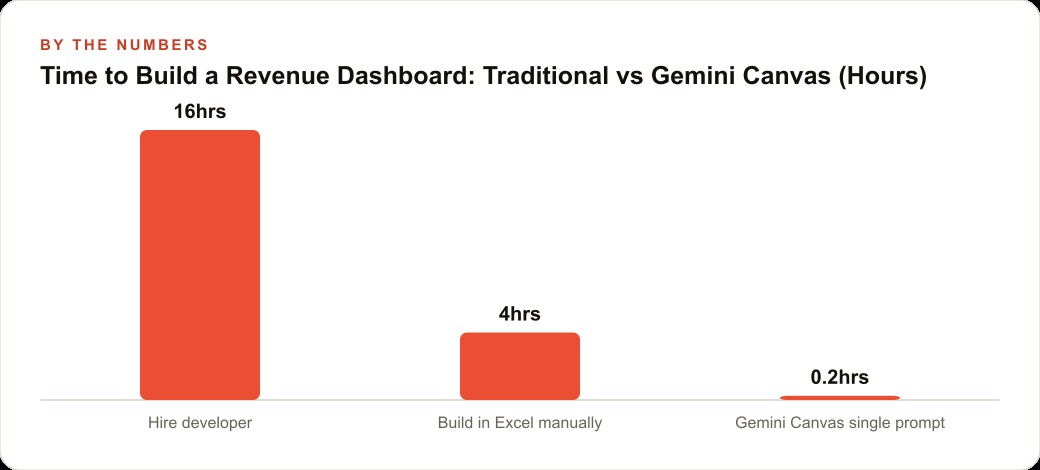
That shift changes the total time required to produce a working financial tool from several hours of building and debugging to 15 to 30 minutes of generating and verifying. For a practice where the owner is doing this work personally, the recovered time is meaningful. For a practice that would otherwise pay a practice management consultant between $2,000 and $4,000 per engagement for this kind of financial modeling work, the recovered cost is significant.
Video analysis without audio adds a capability that most AI coverage glosses over but that has immediate practical use for any practice that records its operations. Gemini 3 Pro analyzed a screen recording with no audio track and accurately described the popup notifications, visible names, and the specific application being developed on screen. For a clinic that records onboarding sessions, procedure walkthroughs, or training demonstrations, this means those recordings can be summarized and turned into structured documents without any manual transcription step.
The three-hour Canvas session that replaces a week of spreadsheet work
A practical session run to test Canvas for a practice context lasted approximately three hours and covered four distinct tools: a revenue projection model, a patient load distribution calculator by provider, a reimbursement payer mix analyzer, and a patient education rewrite of a standard home care handout. All four were completed in that session. Three of the four were interactive tools. One was a revised written document. The total time a practice would normally need to commission or build all four would span days to weeks depending on what internal resources were available.
The reimbursement payer mix analyzer is worth describing because it illustrates the Canvas capability on a problem that practices genuinely struggle with. A practice seeing patients under six different insurance payers with different reimbursement rates, different authorization requirements, and different volume-to-revenue ratios needs a tool that shows how shifts in the payer mix affect total monthly revenue. Building that in a spreadsheet requires understanding how to structure the formula dependencies correctly. Building it in Canvas requires describing what you need in plain language. The tool that came back had sliders for the percentage of visits under each payer, a revenue calculation that updated in real time as the sliders moved, and a chart showing the payer mix distribution alongside the projected monthly revenue. One prompt and approximately two minutes.
Gemini 3 Pro is available at gemini.google.com with the thinking model enabled at no subscription cost for standard use. Higher usage limits and enterprise features are available on paid plans and through Google's Vertex AI platform for teams that need them. For a practice doing exploratory scenario planning and patient communication work, the free tier is sufficient for a meaningful share of the use cases.
What this moment actually means for a six-provider practice
The chiropractic practice example makes the practical value concrete. Six providers. Approximately 80 patient visits per week. Average reimbursement of $85 per visit across the payer mix. Fixed overhead of $380,000 per year. The owner wants to understand the revenue impact of different growth scenarios before making a decision about adding a seventh provider.
A prompt describing the practice structure and asking Canvas to build an interactive revenue model took approximately 90 seconds to generate the tool. The resulting model had sliders for visit volume, provider utilization, average reimbursement rate, and new patient percentage. A break-even line updated in real time as the sliders moved. A 12-month projection chart recalculated automatically after each input change.
Moving the new patient slider from the current level to a 15 percent increase showed $54,060 in additional annual revenue at the current reimbursement rate and provider utilization. The owner could immediately see that the revenue case for adding a seventh provider required either reaching that new patient growth target or improving provider utilization by a specific amount, not both simultaneously. The analysis that would have cost between $2,000 and $4,000 with a practice management consultant or a full weekend of manual spreadsheet work took an afternoon with a free Google account and one plain-language prompt.
This is the gap that closed this week. The analytical tools that large hospital systems have had access to through dedicated data science and financial planning teams are now accessible to a six-provider clinic through a browser interface and a plain-language description of what the practice needs to understand. The output quality, verified against real financial structures, is high enough to serve as the actual tool rather than a rough draft requiring extensive correction.
Two things still require discipline on the part of any practice using this. Any clinic working with patient-identifiable information should not paste that data into the free consumer-tier interface. Enterprise deployments with appropriate data handling agreements are the right path for protected health information. And the output of any Canvas financial tool should be verified against the practice's actual numbers before driving a real business decision. The first-attempt accuracy in testing was high, but a tool built on incorrect input assumptions will produce incorrect outputs regardless of how well the formulas are constructed internally. Verify the structure, check one or two formulas manually, and then use the tool with confidence.
The practice owners who will use tools like this best are the ones who spend the time to describe what they actually need clearly. A vague prompt produces a generic tool. A prompt that describes the specific practice structure, the specific payer mix, the specific question being asked, and the specific decision it needs to inform produces a tool that serves that exact decision.
The secondary capabilities around Canvas are worth mentioning for any practice doing more than financial modeling. Video analysis without audio track is useful for any clinic that records onboarding sessions or procedure walkthroughs. Upload a 60-minute training video, ask Gemini to produce a structured summary of what was covered and a checklist of the procedures demonstrated, and the recording that would otherwise sit unused in a shared drive becomes a searchable training asset in a few minutes.
Personal context builds progressively as well. Gemini holds custom instructions and accumulates context from past sessions. For a practice using it regularly, the model learns the documentation style, the payer mix structure, and the communication preferences the practice has established. Output quality in month three is better than in month one because the context the model holds about the practice is richer. This progressive calibration is the difference between a general AI tool and one that genuinely learns how a specific practice operates. The analytical starting point is free and accessible today. The compounding benefit comes from using it consistently enough that the tool's context about the practice becomes a resource in itself. Practices that build that consistent usage habit in the next six months will have a measurable operational advantage over those that approach it as an occasional experiment rather than a systematic part of how the practice runs. The capability is real and the free entry point is accessible. The quality of what comes out depends on the clarity of what goes in.
That is exactly what we do at AI DOERS. Book a private 30-minute call with Madhuranjan Kumar and we will map the fastest path to it for your specific business.
Book your call →
Madhuranjan Kumar
Madhuranjan Kumar brings 20 years of performance-marketing experience and has managed over $200 million in Facebook ad spend for brands across the United States and beyond. His expertise spans the full modern marketing stack: Meta, Google Ads, TikTok, email automation, CRM, and the websites that hold it together. At AI DOERS he turns that track record into lead-generation systems for businesses across every industry.