
Gemini 3 Can Run a Business: What the Vending Bench Win Means for Small Operators
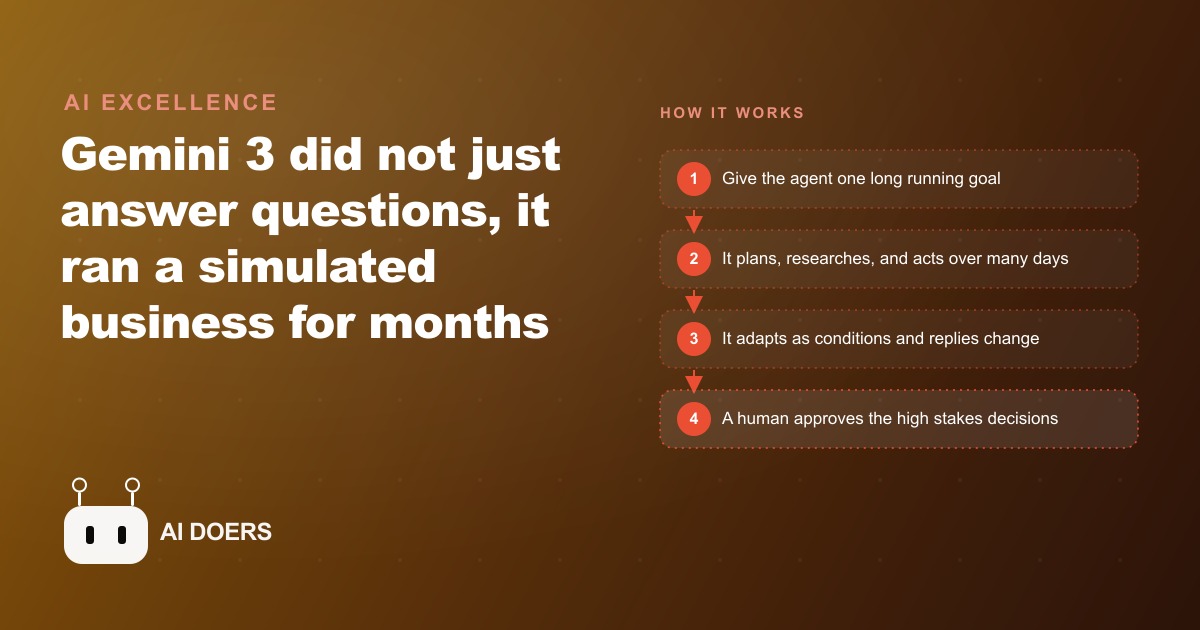
Gemini 3 stopped being a clever chatbot and started behaving like an operator, running a simulated business for months and outgrowing every rival, which is exactly the capability small businesses should put to work.

The result came out on a Tuesday, and the operator read it on their phone between stops, sitting in the cab of their truck in a parking lot outside Dallas.
Reading the Vending Bench Score as a Route Operator
I am Madhuranjan Kumar, and the part of the Gemini 3 release that most people skipped past was the one that mattered most to the people who actually operate things: a simulated vending business.
The Vending Bench test is not a trivia competition or a coding challenge. It gives an AI a starting amount of money and a simulated market for a vending machine operation, and it lets the model manage that business across the equivalent of months of simulated time. The model has to decide what to stock, respond to customer behavior, negotiate with suppliers, adapt when a product stops selling, and compete when another operator enters the same location. The test rewards the same things that matter in a real route business: patience, memory of past results, supplier relationships, and the ability to keep the goal in mind across many separate decisions.
Gemini 3 Pro started with five hundred dollars in the simulation and finished with over five thousand across three hundred fifty simulated days. That is ten times the starting capital. The closest competitor was Claude Sonnet 4.5 at approximately three thousand eight hundred thirty-nine. Grok 4 reached about two thousand. The previous generation, Gemini 2.5 Pro, barely cleared five hundred. The jump between Gemini 2.5 and Gemini 3 on the same test was the most important number in the release, because it showed that the capability had not improved incrementally. It had changed in kind.
The operator of a seven-route vending and refreshment service in the Dallas-Fort Worth area read the result sitting in a parking lot and thought about the one problem they had been unable to solve in four years.
The Problem the Benchmark Was Actually Describing
The problem was route optimization combined with product selection, and it was the problem every route operator hit at scale. With seven routes, each touching between eighteen and twenty-six stops, and each stop carrying between four and nine machines, the combination of routing decisions and product decisions was too large to optimize manually. The owner made decisions on instinct and experience, which worked reasonably well, but it meant that every week there were stops that were overstocked on items that sat and understocked on items that ran out before the driver arrived.
Running out was the worse outcome. A machine that sat empty at a busy stop lost every sale during the downtime. A machine that carried too much slow-moving inventory tied up capital the owner would rather have deployed on faster-turning products at better stops.
The scheduling problem made the product problem worse. Drivers followed a route sequence set two years earlier, and it had not been updated as stop performance changed. Some stops that had been high-volume two years ago had reduced traffic. Others that had been light stops had increased and were now generating demand the route schedule was not serving quickly enough.
The owner had tried managing this with a spreadsheet updated weekly. The spreadsheet tracked par levels and actual sales but could not account for the relationship between visit timing and stockout probability. A stop that sold fast at the beginning of the week but was visited on Thursday was structurally underserved. Seeing that pattern required looking at multiple weeks of data simultaneously in a way the spreadsheet format made difficult.
The Vending Bench result described an AI that had managed exactly this kind of problem in simulation and had done it better than any other model by a significant margin. The owner called their nephew that evening. The nephew had been following AI tools closely for two years and agreed to come over on Saturday to try setting something up.
Setting Up the First Agentic Workflow in Antigrav
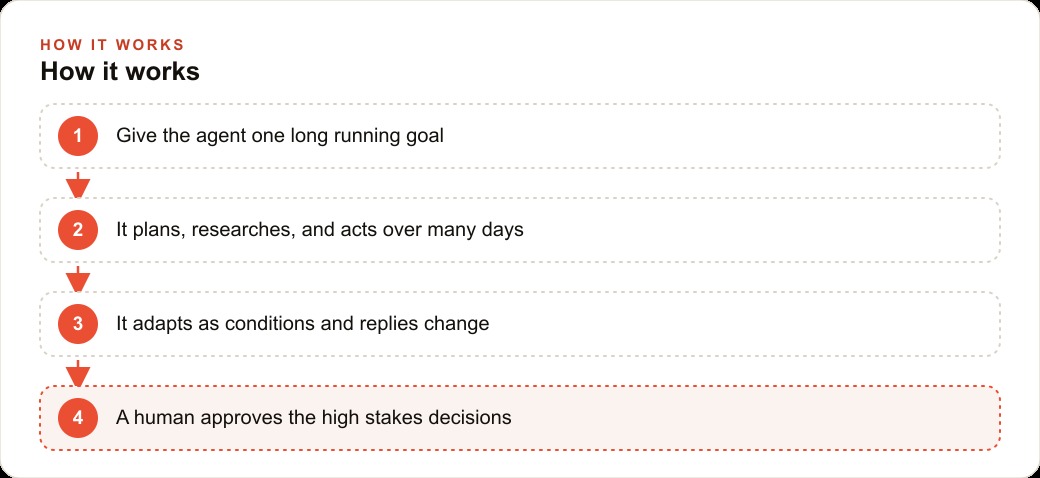
Google had released Gemini 3 alongside a new agentic development platform called Antigrav, designed to let a model execute multi-step tasks across connected tools rather than just answering questions in a chat window. The relevant connection for a route operator was between the sales data in the point-of-sale system and the route scheduling information.
The nephew spent the Saturday building the initial workflow. The goal was specific and narrow: each week, generate a prioritized restock list for each route, flagging any stop where the current par level had been wrong for more than two consecutive visits. That was the first task and nothing more. Just the flag, not the full optimization.
Antigrav connected Gemini 3 to the exported files from the point-of-sale system, which the owner had been saving weekly for about eighteen months. That historical data was the foundation the model needed. The prompt described the business logic in plain terms: a stop is underperforming its par level if actual sales exceeded the restocked quantity in two or more of the last four visits; a stop is overstocked if the driver restocked less than fifty percent of the par level in two or more of the last four visits; generate a list of both categories organized by route for the upcoming week.
The model ran against the historical data. It returned a list organized by route. For route three, it flagged eleven stops as likely underperforming their par levels and four stops as likely overstocked. The owner looked at the list. Eight of the eleven underperforming flags were stops they already knew about. Three were surprises: stops they had not been watching closely because the sales numbers looked acceptable on a monthly summary but had a consistent weekly timing problem that only appeared when you looked at visit-by-visit data.
The owner drove route three the following Wednesday with the list on their phone.
Where Gemini 3 Got It Right and Where the Human Stayed In
The model's flagged stops were accurate on thirteen of the fifteen. Two of the eleven underperforming flags turned out to be stops where the sales were high because the driver had been filling them manually in response to complaints the owner had not heard about. The real problem at those stops was a communication gap between the driver and the owner, not a par level gap. The model could not know about the informal driver behavior because it was not in the data.
The two overstocked flags were both correct. The owner reduced the par levels on those machines immediately. One of them had not been touched in three weeks because the driver assumed the owner wanted that product there and had not raised the concern.
The model's route suggestions included one limitation the owner noticed quickly. It was recommending visit frequency adjustments based purely on volume thresholds, without accounting for the physical geography of the route. Two stops it suggested visiting more frequently were on opposite ends of a corridor that made visiting them on the same day impractical without significantly extending the drive time. A driver who knew the route physically would never suggest that sequence, but the model had no map awareness in the initial setup.
The nephew added a constraint to the workflow: no visit frequency change recommendation for stops more than eight miles apart on the same route segment without an explicit override note. The model adapted its suggestions in the following week's output.
That pattern, the model getting the data reasoning right and the human catching the operational context it could not see, was the consistent dynamic across the first month. The model was not replacing the owner's judgment. It was surfacing the patterns in the data that the owner had not had time to look for, and the owner was applying judgment about whether each suggestion was practical given what the model did not know about the physical reality of the routes.
The First Month's Numbers, Route by Route
At the end of thirty days, the owner had run the workflow every week and had implemented the model's suggestions with some adjustments across all seven routes.
The most direct measurement was stockout frequency. Before the workflow, the owner estimated roughly three to five stockout events per week across the whole operation, based on driver reports. In the first month, reported stockouts dropped to an average of one point four per week. Some of that improvement came from the par level corrections. Some came from more frequent visits to the high-volume stops the model had identified as underserved.
The more interesting number was the capital tied up in slow-moving inventory. The owner did a physical count at the start of the experiment and another at the end of thirty days. Inventory carrying value in the category of items that had been sitting at overstocked stops dropped by approximately nineteen percent. That capital was available for reorder on the faster-turning products.
Route three showed the clearest result. Route three had been the most problematic route in terms of stockout complaints. In the four weeks before the experiment, route three generated nine driver-reported stockout events. In the first month of using the workflow, route three generated two. The par level corrections on six stops on that route were the primary cause, and those corrections came directly from the model's analysis of the eighteen months of historical sales data.
The owner also tracked average revenue per stop on route three as a directional indicator, aware that the metric blended too many variables for precision. Route three's average revenue per stop in the month before the experiment was three hundred twelve dollars. In month one of the experiment it was three hundred seventy-eight dollars. A sixty-six dollar improvement per stop across twenty-two stops on route three was approximately one thousand four hundred fifty-two dollars of additional monthly revenue from one route, driven primarily by fewer out-of-stock events and better product placement at the stops the model had flagged.
Those numbers are illustrative of what the operator observed rather than a formula that will produce identical results on every route. The improvement magnitude depends on how wrong the prior par levels were, how consistently the historical data was recorded, and how quickly the owner implements the suggested changes. But the direction is consistent: a model that can analyze eighteen months of visit-by-visit sales data and flag the stops where the numbers show a structural mismatch is surfacing information that was always in the data and was never being used.
The Second Month: Adding Supplier Comparison to the Workflow
The owner expanded the workflow to all seven routes in month two and asked the nephew to add a second capability. The Vending Bench test had shown Gemini 3 negotiating persistently with suppliers and finding better terms over time. The owner wanted to see whether the model could do something similar for their actual purchasing.
The nephew added a supplier comparison step to the Antigrav setup. Each week, the workflow pulled the pricing data from two distributors the owner used and flagged any product they were buying from distributor A that was available at a lower cost from distributor B on their next reorder cycle. The comparison ran automatically and returned a list organized by product category, showing the current price, the alternative price, and the approximate monthly savings if the owner switched suppliers on that item.
The model did not close deals with suppliers. The owner did that. But it surfaced the comparison clearly enough that the owner walked into three supplier conversations in month two with specific data on pricing alternatives. They came out of two of those conversations with better terms than they had before. The third supplier matched a competing price on their highest-volume product.
The total monthly savings from the supplier renegotiations in month two was approximately four hundred eighty dollars, which was modest relative to the total purchasing volume but was a direct result of having the data organized in a way that made the conversation easy to have. Before the workflow, the owner knew abstractly that they could probably get better prices but had never taken the time to compile the comparison. The model compiled it every week as part of the same run that generated the par level flags.
By the end of month two, the workflow was running reliably across seven routes and two suppliers, taking about twenty-five minutes of setup each Sunday evening and returning a prioritized action list for the week. The owner's estimate of the total time saved on analysis and route planning was about four hours per week compared to their previous manual approach. What they did with that four hours was drive route four themselves twice, which they had not done in eight months, and catch a machine at one stop that had a mechanical fault no one had reported.
That is exactly what we do at AI DOERS. Book a private 30-minute call with Madhuranjan Kumar and we will map the fastest path to it for your specific business.
Book your call →
Madhuranjan Kumar
Madhuranjan Kumar brings 20 years of performance-marketing experience and has managed over $200 million in Facebook ad spend for brands across the United States and beyond. His expertise spans the full modern marketing stack: Meta, Google Ads, TikTok, email automation, CRM, and the websites that hold it together. At AI DOERS he turns that track record into lead-generation systems for businesses across every industry.