
Five AI Projects You Can Actually Build, From No-Code Prompt to Custom App
Five practical AI projects, each shipping at three levels: a no-code prompt version, an intermediate Python version, and a full custom app with your own retrieval. Start today and only go deeper when the project earns it.

Every business has a number it cannot answer with confidence. For a roofing contractor, that number is usually one of two things: the true average cost per job type across the past two years of completed work, or the specific combination of conditions that consistently produces thin margins. These numbers exist inside the business's own records. The problem is that extracting them from a folder of job sheets and PDF inspection reports has always cost more time than the answer seemed worth. AI projects built on your own business data change that calculation, but only when you build them in the right order. This is the story of one roofing company owner who learned that sequence the hard way.
The week the estimate backlog hit twelve jobs and something had to change
The owner runs a residential roofing company in the midwest with a crew of seven and closes roughly one hundred twenty to one hundred fifty jobs per year. He has a project manager and an office coordinator. What he does not have is a data analyst, and by late autumn the absence of that function had become a practical bottleneck.
The estimate backlog that week sat at twelve pending jobs. Three were insurance replacements requiring itemized documentation of materials, labor, and overhead in a format specified by the adjuster. Four were standard reshingling quotes. Five were inspection reports that needed to be summarized into a homeowner-readable one-page format before a signed contract could realistically be expected. The project manager was handling two of the insurance jobs. The owner was handling everything else in addition to running field operations.
The bottleneck was not the work itself. It was the time required to produce structured documents from unstructured field notes: shorthand inspection notes, photos captioned after the fact, supplier quotes in formats that differed by vendor and changed quarterly. Turning a field inspection into a finished estimate took between ninety minutes and three hours depending on the job. Across twelve pending estimates, that was somewhere between eighteen and thirty-six hours of document work that needed to happen before any of those jobs could close.
Alongside the backlog, the owner had a question he had never been able to answer satisfactorily in five years of running the business: which job type produced the highest variance in actual versus estimated cost per square foot? He suspected architectural shingles on pre-1980 structures with existing deck damage were the jobs where he consistently underestimated, because those jobs seemed to always run over and yet he kept pricing them the same way. He had never verified this because verifying it would have required reviewing more than a hundred completed job files manually. That was not a realistic use of his time.
He described the situation to a colleague at a trade association lunch as being buried in paper that contained the answers to questions he was making expensive guesses about. His colleague mentioned he had been using AI tools on his own business data for several months. That was the start of a three-month sequence that changed how the company operated.
Starting at level one: a prompt and a CSV from last quarter's jobs
The first build took forty minutes. The owner exported the past quarter's completed jobs from his job-cost tracking spreadsheet as a CSV file: one row per job, with columns for job type, materials cost, labor hours, overhead allocation, revenue, and a short notes field describing any unusual conditions. He attached the file to a chat session with a capable AI model and wrote a structured prompt built around five clear elements: who he needed the assistant to be (an experienced construction cost analyst), what he wanted (a categorized breakdown of actual materials cost per square foot by job type, with identification of the two job types with the widest variance from the category average), when the analysis should cover (the previous quarter), where the data was (the attached CSV), and why it mattered to him (to adjust his estimating templates before the next busy season and to identify where he was systematically underpricing).
The output identified that his architectural shingle reroof jobs on pre-1980 structures averaged twenty-three percent more in materials cost per square foot than his estimate templates assumed. The reason was visible in the notes field: those jobs consistently required additional deck repair and vapor barrier work that he had been absorbing rather than pricing in. The analysis also identified that his flat-to-pitched conversion jobs ran over on labor hours in every single instance in the data, again in a pattern consistent enough to be structural rather than random.
He had suspected both patterns. He had never had the structured view to confirm them. The session took forty minutes, cost him nothing beyond the model subscription he already held, and produced two concrete adjustments to his estimating templates that he made immediately. He applied both adjustments to three of the twelve pending estimates that same afternoon.
The level-one approach had a clear limit: he could only attach so much data in a single session. His full job history across five years of operation was far too large to include in a chat conversation. The quarter of data had answered the questions he could see. Answering the questions he could not yet see required access to all of it.
Two weeks later: a Python script that reads every past inspection report
Two weeks after the first session, with help from a developer contact who spent four hours across two evenings, the owner had a Python script that read every past inspection report stored in his company's shared drive folder. The reports were PDFs, and the script converted each one to text, chunked it into sections sized for the model's context window, and extracted five standard fields from each one: property address, roof type, estimated square footage, identified damage categories, and a notes field capturing any unusual conditions the inspector had flagged.
The extracted data was written to a structured spreadsheet, one row per report.
The script processed four hundred and twelve reports over a weekend run. Approximately eighteen contained handwritten sections that the text conversion did not read cleanly, and those required manual review afterward. The remaining three hundred and ninety-four came through with clean, usable extracted fields. The process that would have taken weeks of manual review ran overnight.
The resulting spreadsheet was the first structured, searchable version of five years of inspection data the company had ever had. The owner spent one afternoon reviewing the patterns it surfaced and found three he could act on immediately: a specific geographic area in which the proportion of jobs with existing deck damage was nearly double the company-wide average, a roof type in which his labor estimates were consistently low regardless of job size, and a damage description category that appeared in nearly every job that had later required a significant materials cost overrun. None of those patterns had been visible from the job-by-job view he had been working from.
The SEO and organic search presence the company was building through its local service pages became sharper once the owner could describe the specific job types and geographic areas where his team had the most documented experience, because that specificity came directly from the inspection database rather than from general claims.
The first time retrieval answered a question the owner had been guessing about for years
The level-two build produced a structured database. The level-three build made that database queryable in plain language.
The developer spent another evening setting up a retrieval system: the five years of extracted inspection data was indexed into a searchable store, and the owner could type a question about past jobs and get an answer grounded in the actual records rather than in what the model had learned from its training. No guessing. No general industry knowledge. The answers came from the company's own five years of data.
The first question he typed was the one he had been estimating around for years: across jobs with original shingle installation dates before 1985 and in the materials category he was most frequently asked to work with, what was the actual labor hour variance between his estimate and the final invoice? The retrieval system found the relevant records and returned a specific answer: the average variance was thirty-one percent over estimate, across twenty-two jobs in the database that matched those two criteria. His estimating templates had been building in a twelve percent labor buffer for those jobs. He had been underpricing a specific, repeatable job category by roughly nineteen percentage points of labor cost, consistently, for years.
The revenue impact of answering that question correctly became visible over the following two months. He repriced the job category using the actual historical variance and won six new contracts at the adjusted rate over that period. The jobs were priced competitively within his market but now covered his real labor cost. For the first time, that job category closed at the margin he had projected rather than below it.
His Google Ads campaigns for the affected job categories were adjusted simultaneously, targeting the zip codes where the inspection database showed the highest density of pre-1985 structures, because those were the areas where the adjusted pricing was both necessary and likely to face the least price resistance.
What the building-blocks taught beyond the specific projects
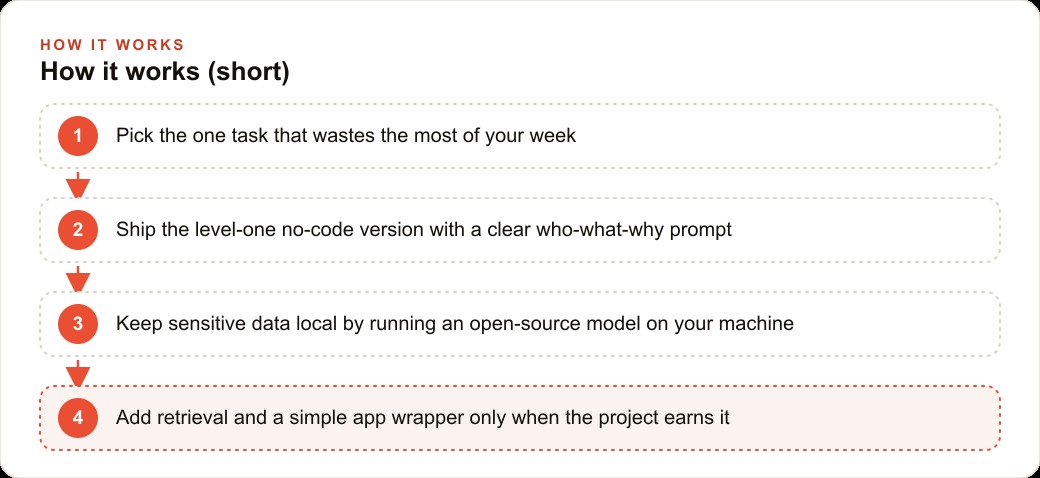
The most important thing the owner took from the first three builds was not the specific outputs from each one. It was that the same four building blocks appeared in every project and transferred directly from one to the next.
Structured prompting appeared in every build. The five-element framework he used in the first CSV session worked equally well on the inspection report extraction, on a supplier price comparison he built a month later, and on a draft contract summary he put together in month four. Writing a clear role, a specific goal, a defined time scope, a pointer to the data, and an explanation of why the output mattered consistently produced better results than writing a vague request.
Context awareness determined which approach was appropriate for each build. Short analysis tasks worked well with a standard context window. The full five-year inspection database was too large for that approach and required chunking at level two and retrieval at level three. Understanding which approach the data size required was the judgment call that determined whether a build succeeded or wasted time trying to fit too much into one session.
Chunking was the technical translation of that judgment into practice. The script that processed the inspection reports split each PDF at natural section boundaries rather than at arbitrary character counts. That distinction mattered: splitting at character counts cut sentences and damaged extraction quality. Splitting at boundaries preserved the context around each extracted field and produced cleaner results.
Interface wrapping was the step that made the builds usable by someone other than the owner or the developer. By month four, a simple browser-based dashboard allowed the office coordinator to query the inspection database directly without asking the owner or the developer to run a script. The underlying system was unchanged. What changed was who could use it, which is what converted an internal tool into an operational asset.
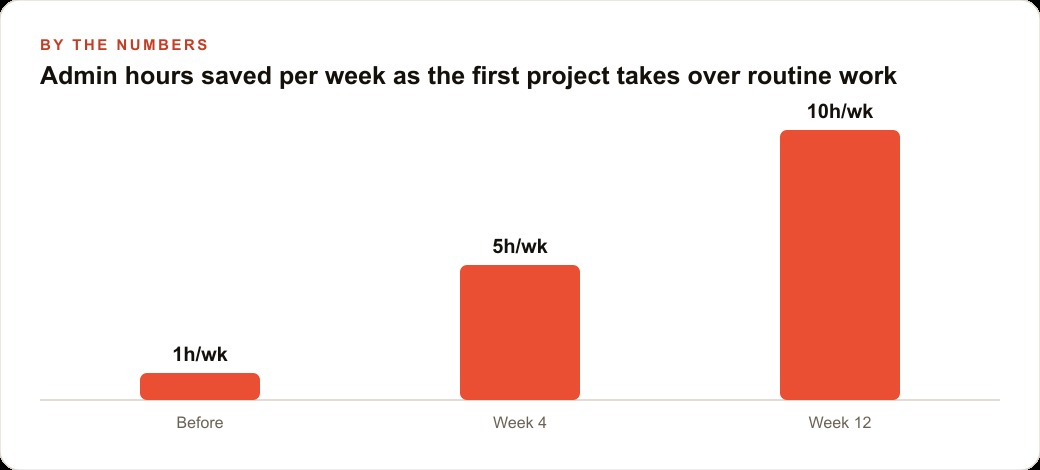
The second project took roughly half the time of the first to build, and the third took half the time of the second. The building blocks were reusable across different data types, different questions, and different formats. Each project built fluency in the same underlying vocabulary, and that fluency compounded.
The project that almost cost more than it saved, and the rule about level three
There was one build that consumed twelve days of the developer's time and produced very little usable output before it was stopped.
The owner had wanted to build a level-three custom quoting assistant: a system where an estimator could describe a job in plain language, attach a set of photos, and receive a complete draft estimate with materials quantities and a labor hour breakdown, ready for review. The concept was sound. The execution required integrating three separate data sources: a custom materials pricing API the company had started using, the five-year inspection database, and a labor-rate table maintained in a format the system could not read cleanly without an additional conversion step. It also required a usable interface the field estimators could operate on a tablet.
The developer spent twelve days on the integration before a review session. The system produced a draft estimate in test conditions on controlled inputs. It failed on real job inputs in seven of the first ten tests because the photo descriptions used in the field varied too much from the structured field format the extraction component expected. Making it robust against real-world variation would have taken at least two additional weeks.
The owner stopped the project. The level-one version of the same task, using a structured prompt with a typed summary of the inspection notes and relevant fields pasted in, was handling new estimate drafts in about twenty minutes per job. The level-three version, fully built, would have reduced that to roughly six minutes. At his current estimate volume, the time saving was real but not large enough to justify the twelve days already invested plus the additional two weeks needed to make it reliable on real inputs.
The rule he applies now before starting any level-three build: prove that the level-one version saves meaningful time or improves output quality over the current process. Then prove that the level-two version saves meaningful additional time over the level-one version. Only after both of those proofs exist in actual use does a level-three build earn its investment. Level three amplifies a working foundation. It does not create value from a process that has not yet been validated at the simpler levels. Starting there skips the two tests that would have told him, in under a week, that the quoting assistant needed a cleaner input format before anything else.
That is exactly what we do at AI DOERS. Book a private 30-minute call with Madhuranjan Kumar and we will map the fastest path to it for your specific business.
Book your call →
Madhuranjan Kumar
Madhuranjan Kumar brings 20 years of performance-marketing experience and has managed over $200 million in Facebook ad spend for brands across the United States and beyond. His expertise spans the full modern marketing stack: Meta, Google Ads, TikTok, email automation, CRM, and the websites that hold it together. At AI DOERS he turns that track record into lead-generation systems for businesses across every industry.