
How AI Turns Your Raw Business Data Into Professional Excel Reports and Pitch Decks in Minutes
Claude can now take a CSV of your monthly revenue and produce a formatted, chart-ready Excel workbook and a bank-ready PowerPoint presentation in minutes. Here is how to use it for real business situations.


A bank that processes forty loan applications in a single morning does not spend equal time on each one. The application backed by a formatted financial workbook, clean monthly revenue charts, and a five-slide executive summary holds attention for several minutes. The application submitted as a printed spreadsheet with raw columns and no visual summary gets thirty seconds. Claude can now take the CSV data that already lives in your booking software, point-of-sale system, or accounting tool and produce a real, downloadable Excel workbook and a PowerPoint pitch deck formatted to the standard that banks and investors actually expect.
This is not about generating reports that look impressive but contain nothing. It is about taking the story your financial data already tells and presenting it in a format that makes the reader confident in what they are seeing. The data exists. The gap that costs small business owners loan approvals, contract wins, and investment conversations is the lack of a formatted document that communicates what the data means. That gap closes in an afternoon.
Prepare your CSV before Claude ever sees it
The quality of the generated document depends entirely on the quality of the data you upload. Claude interprets data thoughtfully, but it cannot correct structural problems in your CSV before building tables and charts from it. Three issues in your source file cause errors in the final document: inconsistent date formats, vague column headers, and merged cells.
Inconsistent date formats are the most common problem. If one row shows "Jan 2024," another shows "01/2024," and a later row shows "January-24," Claude may assign chart values to the wrong time periods or generate a timeline that does not sort chronologically. Standardize every date to the same format before uploading. "January 2024" for every row works cleanly. A numeric format like "2024-01" also sorts correctly and avoids any ambiguity about day versus month.
Vague column headers are the second issue. A column labeled "Total" tells Claude nothing useful about what it measures. "Total Monthly Revenue" or "Monthly Service Revenue" gives it enough context to write appropriate chart titles, name the workbook tabs correctly, and label the chart axes without guessing. Spend ten minutes renaming every column header in plain English before uploading. This single step accounts for most of the difference between a workbook that reads as professional and one that reads like a data export.
Merged cells are the third problem. Many business owners maintain spreadsheets with merged header rows or merged subtotal cells that look fine on screen but break down in CSV exports. Export a clean, flat CSV with one header row and one data row per time period before uploading anything. If you are pulling from a system that generates exports with merged cells or summary rows, clean those out first.
If your revenue and expense data live in separate systems, export each as its own CSV file. Upload both files in the same Claude session and specify in your prompt that they should populate separate tabs in the workbook. Claude will build the full multi-tab document from multiple sources without requiring you to combine the files manually.
Write the prompt that tells Claude who will read this document
The audience specification in your prompt is the single most important instruction you give. The reader determines the document structure, the choice of metrics to emphasize, the level of detail on each tab, and the framing on every slide. A loan officer, an investor, and a business partner all want to see the same underlying data presented in completely different ways.
A community bank loan officer reviewing an expansion loan needs revenue stability across at least eighteen to twenty-four months, a clear picture of expense control, net profit with no unexplained anomalies, and a brief factual narrative about the business and the intended use of funds. They do not want projections that stretch years into the future or market size slides. They want evidence that the business is real, has consistent cash flow, and can service the loan.
An investor looking for equity participation wants a different document entirely. They want to see the trajectory: revenue growth rate month over month, the underlying driver of that growth, what the unit economics look like, and where the business goes with capital injection. A five-year forward projection is appropriate for this audience. Forward-looking framing about market opportunity makes sense here.
A business partner reviewing shared finances wants visibility into every cost category, reconciliation between the top-line revenue number and the actual profit, and the ability to spot which periods outperformed and which did not, without the commercial framing that belongs in an investor document.
Your prompt should state the audience explicitly and specifically. "This report is for a community bank loan officer reviewing a $40,000 expansion loan for a hair salon that has operated for three years" gives Claude everything it needs to make the right structural choices. "Make me an Excel report" gives it nothing.
What a strong bank-ready Excel workbook looks like after generation
A properly constructed bank-ready Excel workbook from Claude has at minimum three tabs, each with a clear purpose and professional formatting throughout.
The revenue tab shows monthly revenue across the full time period you specified. The table has a clear header row formatted in a neutral professional color, alternating row shading that makes horizontal scanning easy, dollar formatting on every value column, and a line chart below the table showing the revenue trend. The chart x-axis carries month labels in chronological order. The y-axis carries dollar values. The chart title identifies what is being measured. A properly labeled chart tells the loan officer the story without requiring them to read across twenty-four rows of numbers.
The expense tab organizes your cost categories across the same time period. It should use a bar chart showing the category breakdown across the most recent three to six months, which communicates the expense structure at a glance. The specific expense categories should match your source data rather than being invented. Your prompt should name the categories explicitly if they differ from generic ones.
The profit tab performs the net calculation and applies conditional formatting that makes the profitability story immediately visible. Months where net profit exceeded a defined threshold appear highlighted in green. Months that fell below a lower threshold appear in amber. This single visual device allows a reader to assess the business's financial history in seconds. If there was one difficult quarter in year two followed by a strong recovery, the color pattern tells that story without requiring a written explanation.
The PowerPoint companion for a bank loan presentation should have five slides: a business overview and ownership history slide, a slide with the revenue trend chart embedded, a slide on expense stability and category breakdown, a slide on the growth plan and use of funds with a bullet-point breakdown, and a closing slide with the specific loan amount, projected monthly repayment relative to current cash flow, and the expected revenue increase from the expanded capacity. Each slide should have a clear headline and minimal body text. The chart or table should carry the factual load.
Verify every number before the document leaves your hands
Submitting a financial document that contains one wrong number to a bank is worse than submitting a less polished document, because it creates a credibility problem in the middle of an approval conversation. The verification step is non-negotiable.
Verification of a 24-month workbook takes about fifteen minutes. Open your source CSV alongside the generated Excel file. For the revenue tab, click on each data point in the chart to see its underlying value, then locate the same month in your source data and confirm they match. Do not skim this. Read every number. For the expense tab, spot-check at least three months spread across the full time range: one from the beginning of the period, one from the middle, and one from the most recent data.
Collect all discrepancies in a list before sending any corrections back to Claude. A single correction request listing all issues is more efficient than sending one correction at a time and waiting for a revised file after each one.
When the corrected file comes back, verify only the changed elements specifically rather than re-reviewing the full document. This keeps the cycle fast without skipping the accuracy check.
How to request revisions without reopening everything from scratch
Revisions within the same Claude session require no re-uploading of data and no re-explaining of the document structure. Claude holds the full context of what it built and where the data came from throughout the conversation.
Structure your correction request as a numbered list rather than a paragraph. Numbered corrections are unambiguous about which issue each item refers to and which are new requirements versus corrections to existing elements.
A well-formed revision request reads like this: "1. The March 2024 revenue on tab one shows $12,400 but it should be $8,200. Please correct and update the chart. 2. The trendline is missing from the revenue line chart. Please add a linear trendline. 3. Please add a fourth tab showing quarterly totals with a bar chart comparing each quarter." That structure produces a corrected file where every request has been addressed, rather than a file where some corrections were made and others were missed because the request was ambiguous.
Any new additions, such as an extra tab, a chart type change, or a new slide, should be distinguished from corrections so Claude does not treat them as errors to fix in the existing output.
After each round of revisions, save the generated file with a new version name rather than overwriting the previous version. Document generation sessions can be complex, and having the version before a revision available for comparison is useful if a correction introduces a new issue.
A salon owner's $40,000 loan application: the full walkthrough
The owner of a hair salon that has been operating for three years needs $40,000 to add two styling stations and build out a lash and brow service room. The booking software platform exports monthly revenue broken down by service category: haircuts, color services, treatments, and retail product sales. A separate spreadsheet tracks monthly expenses by category: rent, payroll, supplies, and other costs.
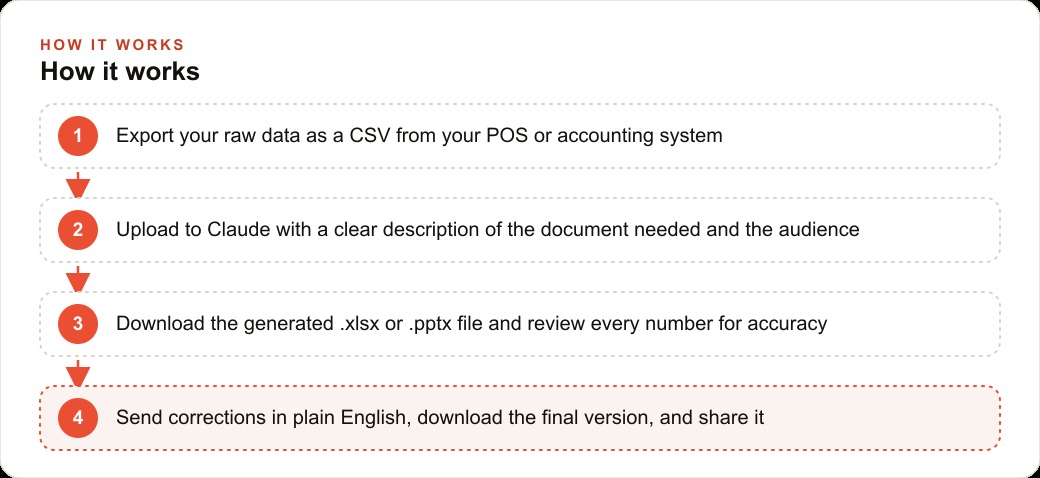
She exports two clean CSVs covering the same 24-month period. She opens a session, uploads both files, and writes the following prompt: "I am the owner of a hair salon applying for a $40,000 business expansion loan from a community bank. Please create an Excel workbook with three tabs. Tab one: monthly revenue by service category over 24 months with a line chart showing the total revenue trend. Tab two: monthly expenses by category with a bar chart showing the most recent three months breakdown. Tab three: net profit per month with conditional formatting, green for months over $7,000 and amber for months under $3,000. Then create a five-slide PowerPoint presentation for the bank loan officer. The business has been profitable for 22 of the 24 months and I want the document to communicate that stability."
The generated Excel workbook has a charcoal header row, light alternating row shading, dollar formatting throughout, labeled chart axes, and a descriptive tab for each section. The conditional formatting on the profit tab makes the one difficult quarter immediately visible alongside the consistent green pattern surrounding it. The PowerPoint presents the business concisely: one slide on the salon's history and service menu, one slide with the 24-month revenue chart embedded, one slide on expense stability with the category bar chart, one slide on the expansion plan with the fund use breakdown, and a closing slide with the loan amount, estimated monthly repayment at a standard interest rate, and the projected revenue from two additional stations operating at expected occupancy.
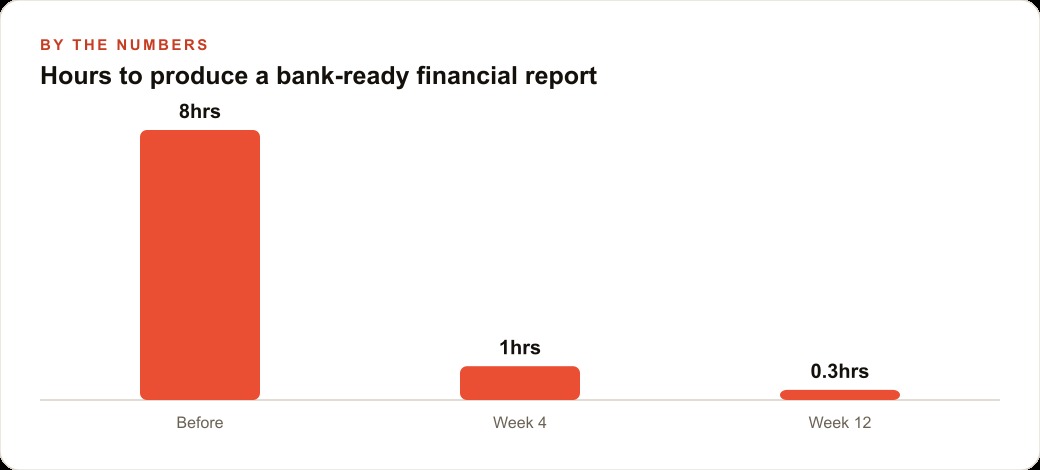
The package that a bookkeeper would have charged $400 to $700 to produce over two to three business days is ready in under fifteen minutes. One verification pass catches a single transposed figure in the revenue tab. A correction request in one sentence produces the revised file. The finished loan package goes to the bank the same afternoon it was started.
When your data is messier than a single clean export
Many businesses do not have 24 months of clean, categorized data in one system. Some owners track revenue in a combination of platforms that changed partway through the relevant period. Some have months with no data because the business was closed. Some have categories that changed as the business evolved.
None of these situations prevent the process from working, but they require explicit description in the prompt rather than leaving Claude to guess. If months are missing because the business was closed for renovation, say so and ask Claude to leave those months blank rather than interpolating values. If two different point-of-sale systems were used and have slightly different category structures, describe the mapping you want and ask Claude to apply it consistently.
Data quality problems that are described explicitly produce outputs with honest gaps and clearly labeled assumptions. Data quality problems that are left undescribed produce outputs that look complete but contain interpretations that may be wrong. A few sentences of context in the prompt addressing known problems with the source data does more for accuracy than any amount of cleanup after the document is generated. Treat the prompt as the place to surface everything you know about what is unusual in your data.
That is exactly what we do at AI DOERS. Book a private 30-minute call with Madhuranjan Kumar and we will map the fastest path to it for your specific business.
Book your call →
Madhuranjan Kumar
Madhuranjan Kumar brings 20 years of performance-marketing experience and has managed over $200 million in Facebook ad spend for brands across the United States and beyond. His expertise spans the full modern marketing stack: Meta, Google Ads, TikTok, email automation, CRM, and the websites that hold it together. At AI DOERS he turns that track record into lead-generation systems for businesses across every industry.